INVESTOR PRESENTATION APPLIED DIGITAL OCTOBER 2025
Investor Presentation— 2025 AppliedDigital.com This presentation has been designed to provide general information about Applied Digital Corporation (“Applied Digital” or the “Company”). Any information contained or referenced herein is suitable only as an introduction to the Company. The information contained in this presentation is for informational purposes only. The information contained herein does not constitute or form a part of, and should not be construed as, any offer for sale or subscription of, or any invitation to offer, buy or subscribe for, any securities, nor shall there be any offer, solicitation or sale in any jurisdiction in which such offer, solicitation or sale would be unlawful. This document is not a prospectus. The information contained in this presentation is not investment or financial product advice and is not intended to be used as the basis for making an investment decision. Neither the Company, nor any of its respective affiliates make any representation or warranty, express or implied as to, and no reliance should be placed on, the fairness, accuracy, completeness or correctness of any of the information or opinions contained in this presentation. This presentation has been prepared without taking into account the investment objectives, financial situation particular needs of any particular person. The trademarks included herein are the property of the owners thereof and are used for reference purposes only. Such use should not be construed as an endorsement of the platform and solutions of Applied Digital. Forward-Looking Statements This presentation contains forward-looking statements that reflect the Company’s current expectations and projections with respect to, among other things, its financial condition, results of operations, plans, objectives, future performance and business. When used in this presentation, the words “could,” “believe,”“anticipate,” “intend,” “estimate,” “expect,” “project” and similar expressions are intended to identify forward-looking statements, although not all forward-looking statements contain such identifying words. Forward-looking statements include all statements that are not historical facts. Forward-looking statements are based on information available at the time those statements are made and/or management’s good faith beliefs and assumptions as of that time with respect to future events. Such forward-looking statements are subject to various risks and uncertainties. Accordingly, there are or will be important factors that could cause actual outcomes or results to differ materially from those indicated in these statements. Forward-looking statements may include statements about the Company’s future financial performance, including the Company’s expectations regarding net revenue, operating expenses, and its ability to achieve and maintain future profitability; the Company’s business plan and ability to effectively manage growth; anticipated trends, growth rates, and challenges in the Company’s business, particularly in the fields of High-Performance Computing (HPC) and Artificial Intelligence (AI); further development and market acceptance of technologies related to HPC and AI; further development of the Company’s facilities and customer base for related services; beliefs and objectives for future operations; trends in revenue, cost of revenue, and gross margin; trends in operating expenses, including technology and development expenses, sales and marketing expenses, and general and administrative expenses, and expectations regarding these expenses as a percentage of revenue; increased expenses associated with being a public company; and other statements regarding the Company’s future operations, financial condition, and prospects and business strategies. There is no assurance that any forward-looking statements will materialize. You are cautioned not to place undue reliance on forward-looking statements, which reflect expectations only as of this date. Applied Digital does not undertake any obligation to publicly update or review any forward-looking statement, whether as a result of new information, future developments or otherwise. Market and Industry Data This presentation includes information concerning economic conditions, the Company’s industry, the Company’s markets and the Company’s competitive position that is based on a variety of sources, including information from independent industry analysts and publications, as well as Applied Digital’s own estimates and research. Applied Digital’s estimates are derived from publicly available information released by third party sources, as well as data from its internal research, and are based on such dataand the Company’s knowledge of its industry, which the Company believes to be reasonable. Any independent industry publications used in this presentation were not prepared on the Company’sbehalf. This information involves many assumptions and limitations, and you are cautioned not to give undue weight to these estimates. The Company has not independently verified the accuracy or completeness of the data contained in these industry publications and other publicly available information. Accordingly, we make no representations as to the accuracy orcompleteness of that data nor do we undertake to update such data after the date of this presentation. An investment in the Company entails a high degree of risk and no assurance can be given that the Company’s objective will be achieved or that investors will receive a return on their investment. Recipients of this presentation should make their own investigations and evaluations of any information referenced herein. 2 / 37
TABLE OF CONTENTS AppliedDigital.com 01 — Company Overview 02 — Artificial intelligence Data Centers 03 — Polaris Forge 1 04 — Polaris Forge 2 05 — Blockchain Data Centers 06 — Macquarie Transaction 08 — Appendix Investor Presentation— 2025 3 / 37
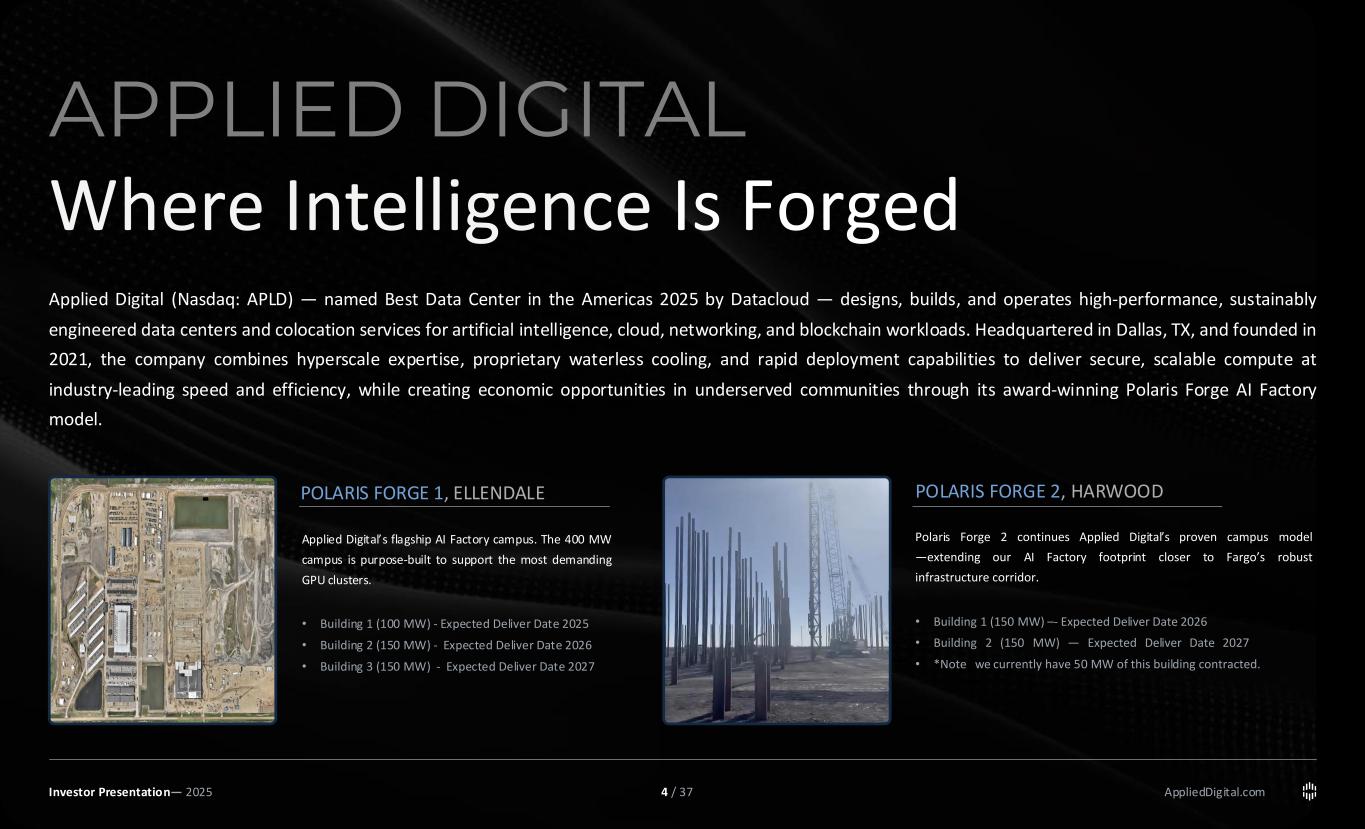
POLARIS FORGE 1, ELLENDALE Applied Digital’s flagship AI Factory campus. The 400 MW campus is purpose-built to support the most demanding GPU clusters. • Building 1 (100 MW) - Expected Deliver Date 2025 • Building 2 (150 MW) - Expected Deliver Date 2026 • Building 3 (150 MW) - Expected Deliver Date 2027 POLARIS FORGE 2, HARWOOD Polaris Forge 2 continues Applied Digital’s proven campus model —extending our AI Factory footprint closer to Fargo’s robust infrastructure corridor. • Building 1 (150 MW) –- Expected Deliver Date 2026 • Building 2 (150 MW) — Expected Deliver Date 2027 • *Note we currently have 50 MW of this building contracted. AppliedDigital.com Applied Digital (Nasdaq: APLD) — named Best Data Center in the Americas 2025 by Datacloud — designs, builds, and operates high-performance, sustainably engineered data centers and colocation services for artificial intelligence, cloud, networking, and blockchain workloads. Headquartered in Dallas, TX, and founded in 2021, the company combines hyperscale expertise, proprietary waterless cooling, and rapid deployment capabilities to deliver secure, scalable compute at industry-leading speed and efficiency, while creating economic opportunities in underserved communities through its award-winning Polaris Forge AI Factory model. APPLIED DIGITAL Where Intelligence Is Forged Investor Presentation— 2025 4 / 37
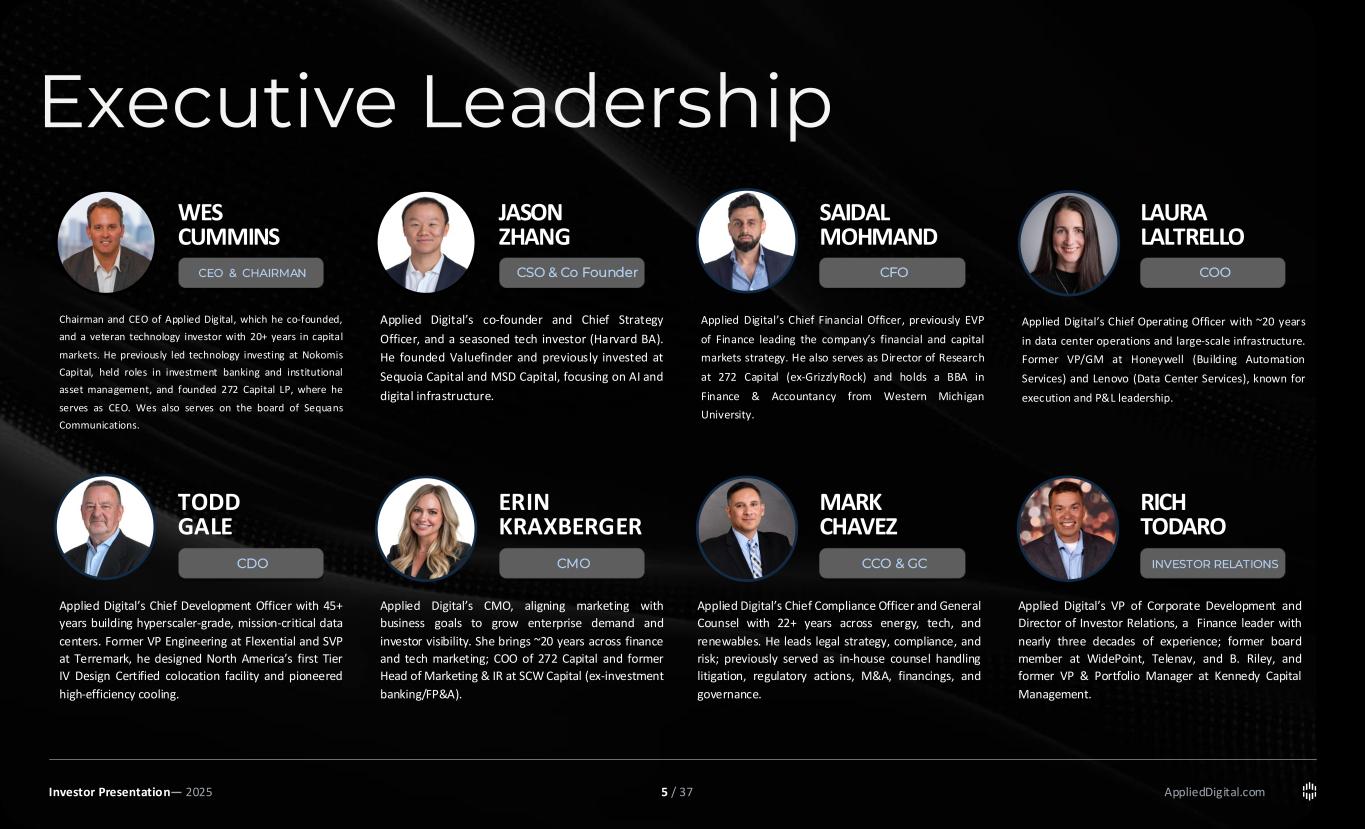
AppliedDigital.com Executive Leadership Investor Presentation— 2025 WES CUMMINS CEO & CHAIRMAN JASON ZHANG CSO & Co Founder Applied Digital’s co-founder and Chief Strategy Officer, and a seasoned tech investor (Harvard BA). He founded Valuefinder and previously invested at Sequoia Capital and MSD Capital, focusing on AI and digital infrastructure. SAIDAL MOHMAND CFO LAURA LALTRELLO COO TODD GALE CDO ERIN KRAXBERGER CMO MARK CHAVEZ CCO & GC RICH TODARO INVESTOR RELATIONS Chairman and CEO of Applied Digital, which he co-founded, and a veteran technology investor with 20+ years in capital markets. He previously led technology investing at Nokomis Capital, held roles in investment banking and institutional asset management, and founded 272 Capital LP, where he serves as CEO. Wes also serves on the board of Sequans Communications. Applied Digital’s Chief Financial Officer, previously EVP of Finance leading the company’s financial and capital markets strategy. He also serves as Director of Research at 272 Capital (ex-GrizzlyRock) and holds a BBA in Finance & Accountancy from Western Michigan University. Applied Digital’s Chief Operating Officer with ~20 years in data center operations and large-scale infrastructure. Former VP/GM at Honeywell (Building Automation Services) and Lenovo (Data Center Services), known for execution and P&L leadership. Applied Digital’s Chief Development Officer with 45+ years building hyperscaler-grade, mission-critical data centers. Former VP Engineering at Flexential and SVP at Terremark, he designed North America’s first Tier IV Design Certified colocation facility and pioneered high-efficiency cooling. Applied Digital’s CMO, aligning marketing with business goals to grow enterprise demand and investor visibility. She brings ~20 years across finance and tech marketing; COO of 272 Capital and former Head of Marketing & IR at SCW Capital (ex-investment banking/FP&A). Applied Digital’s Chief Compliance Officer and General Counsel with 22+ years across energy, tech, and renewables. He leads legal strategy, compliance, and risk; previously served as in-house counsel handling litigation, regulatory actions, M&A, financings, and governance. Applied Digital’s VP of Corporate Development and Director of Investor Relations, a Finance leader with nearly three decades of experience; former board member at WidePoint, Telenav, and B. Riley, and former VP & Portfolio Manager at Kennedy Capital Management. 5 / 37
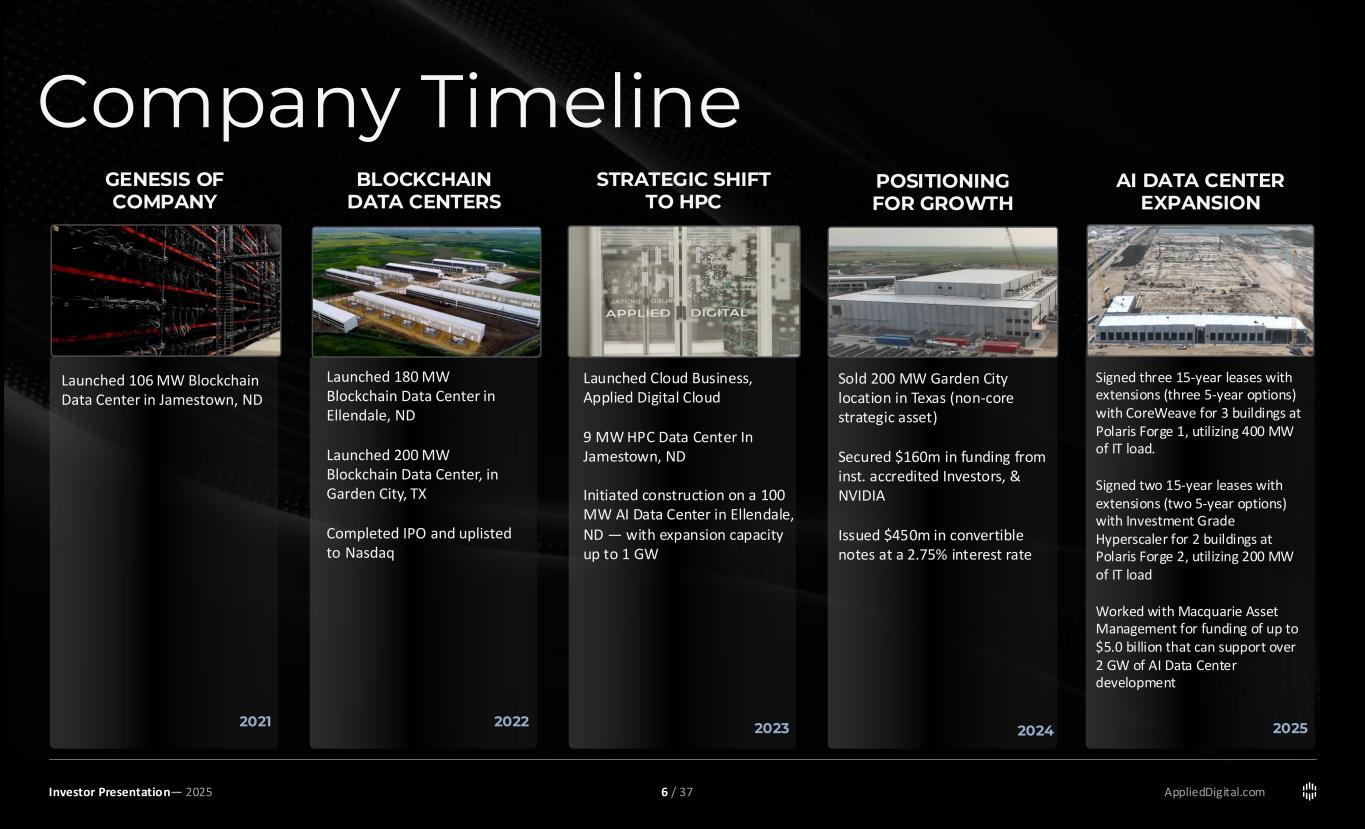
AppliedDigital.comInvestor Presentation— 2025 GENESIS OF COMPANY BLOCKCHAIN DATA CENTERS STRATEGIC SHIFT TO HPC POSITIONING FOR GROWTH AI DATA CENTER EXPANSION Launched 106 MW Blockchain Data Center in Jamestown, ND Launched 180 MW Blockchain Data Center in Ellendale, ND Launched 200 MW Blockchain Data Center, in Garden City, TX Completed IPO and uplisted to Nasdaq Launched Cloud Business, Applied Digital Cloud 9 MW HPC Data Center In Jamestown, ND Initiated construction on a 100 MW AI Data Center in Ellendale, ND — with expansion capacity up to 1 GW Sold 200 MW Garden City location in Texas (non-core strategic asset) Secured $160m in funding from inst. accredited Investors, & NVIDIA Issued $450m in convertible notes at a 2.75% interest rate Signed three 15-year leases with extensions (three 5-year options) with CoreWeave for 3 buildings at Polaris Forge 1, utilizing 400 MW of IT load. Signed two 15-year leases with extensions (two 5-year options) with Investment Grade Hyperscaler for 2 buildings at Polaris Forge 2, utilizing 200 MW of IT load Worked with Macquarie Asset Management for funding of up to $5.0 billion that can support over 2 GW of AI Data Center development Company Timeline 6 / 37
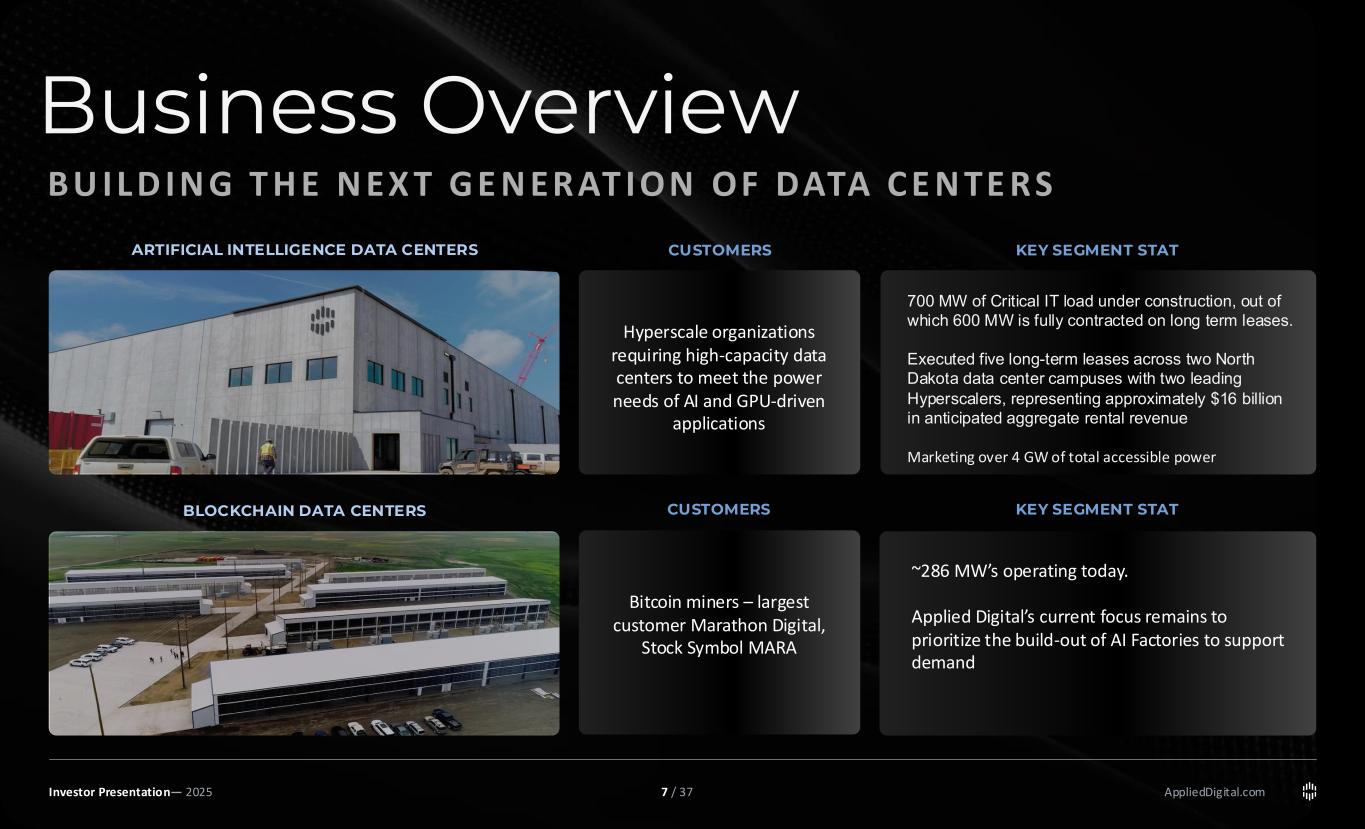
AppliedDigital.com Business Overview Investor Presentation— 2025 B U IL D IN G T H E N EX T G E N ERAT ION OF DATA C E N TE RS ARTIFICIAL INTELLIGENCE DATA CENTERS BLOCKCHAIN DATA CENTERS CUSTOMERS KEY SEGMENT STAT Hyperscale organizations requiring high-capacity data centers to meet the power needs of AI and GPU-driven applications Bitcoin miners – largest customer Marathon Digital, Stock Symbol MARA 700 MW of Critical IT load under construction, out of which 600 MW is fully contracted on long term leases. Executed five long-term leases across two North Dakota data center campuses with two leading Hyperscalers, representing approximately $16 billion in anticipated aggregate rental revenue Marketing over 4 GW of total accessible power ~286 MW’s operating today. Applied Digital’s current focus remains to prioritize the build-out of AI Factories to support demand CUSTOMERS KEY SEGMENT STAT 7 / 37
ARTIFICIAL INTELLIGENCE AppliedDigital.com Rising Power Demand from AI and the Impact on Data Centers Investor Presentation— 2025 02 8 / 37
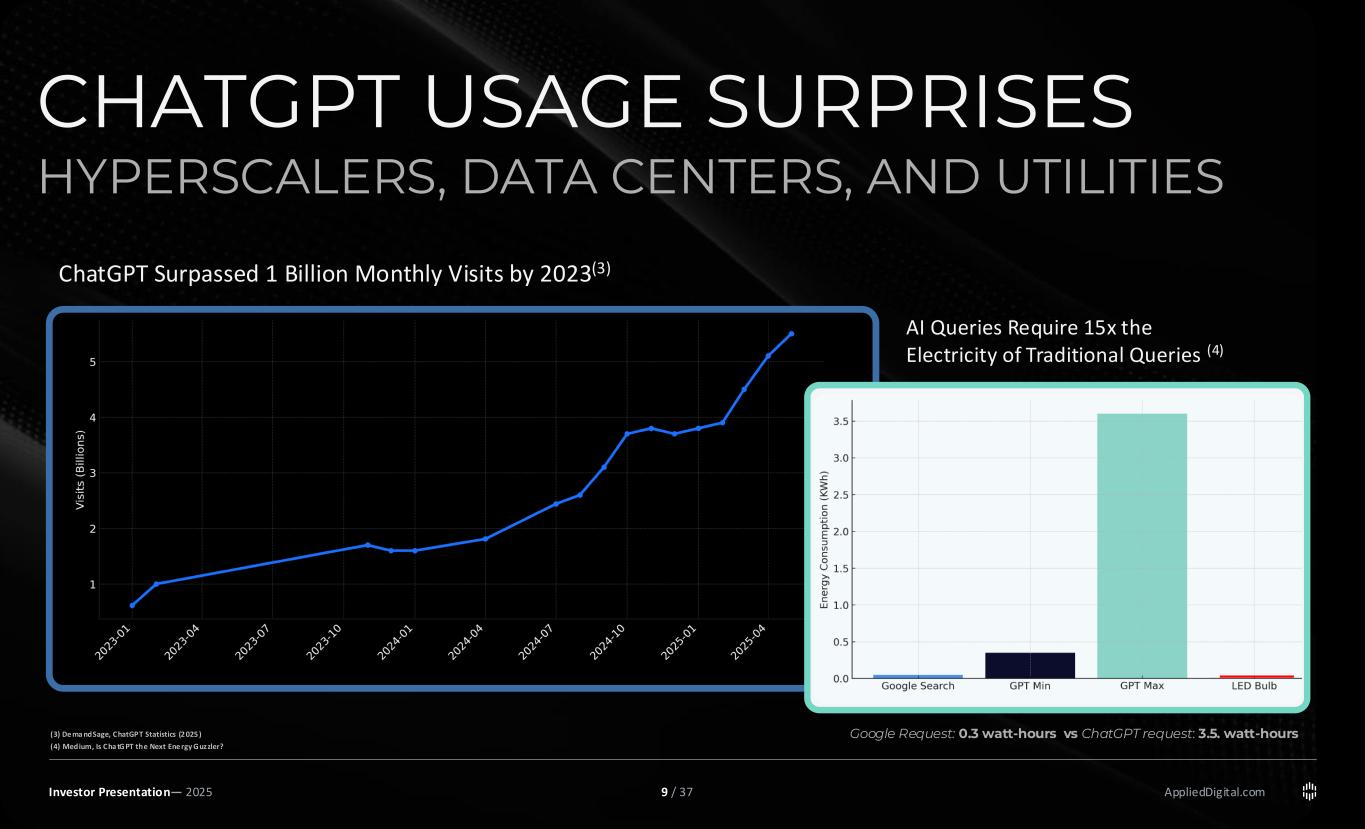
AppliedDigital.com CHATGPT USAGE SURPRISES HYPERSCALERS, DATA CENTERS, AND UTILITIES Investor Presentation— 2025 Google Request: 0.3 watt-hours vs ChatGPT request: 3.5. watt-hours AI Queries Require 15x the Electricity of Traditional Queries (4) ChatGPT Surpassed 1 Billion Monthly Visits by 2023(3) (3) De ma ndSage, ChatGPT Statistics (2 025 ) (4) Medium, Is Cha tGPT the Next Ene rgy Guzzler? 9 / 37
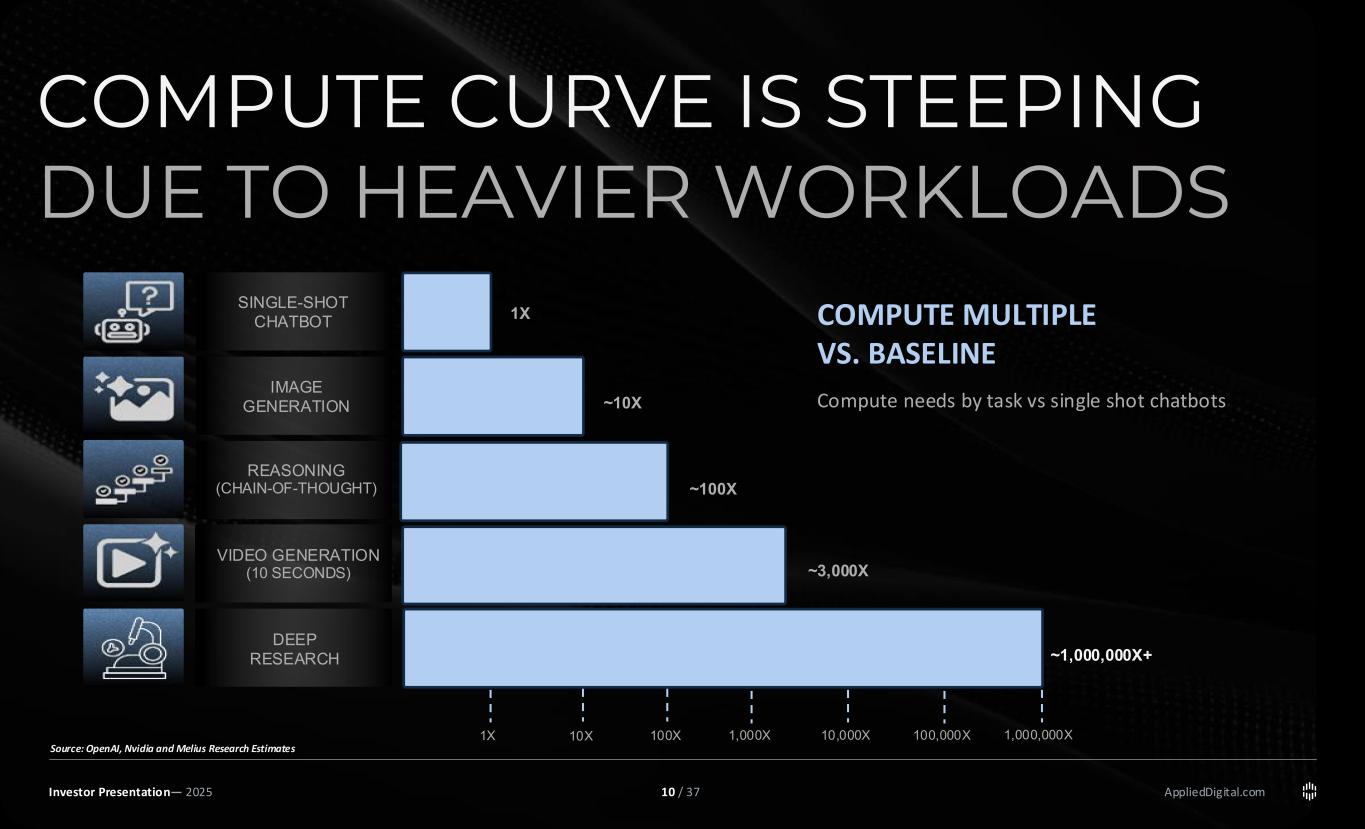
AppliedDigital.comInvestor Presentation— 2025 COMPUTE CURVE IS STEEPING DUE TO HEAVIER WORKLOADS COMPUTE MULTIPLE VS. BASELINE Compute needs by task vs single shot chatbots SINGLE-SHOT CHATBOT IMAGE GENERATION REASONING (CHAIN-OF-THOUGHT) VIDEO GENERATION (10 SECONDS) DEEP RESEARCH 1X 10X 100X 1,000X 10,000X 100,000X 1,000,000X 1X ~10X ~100X ~1,000,000X+ ~3,000X Source: OpenAI, Nvidia and Melius Research Estimates 10 / 37
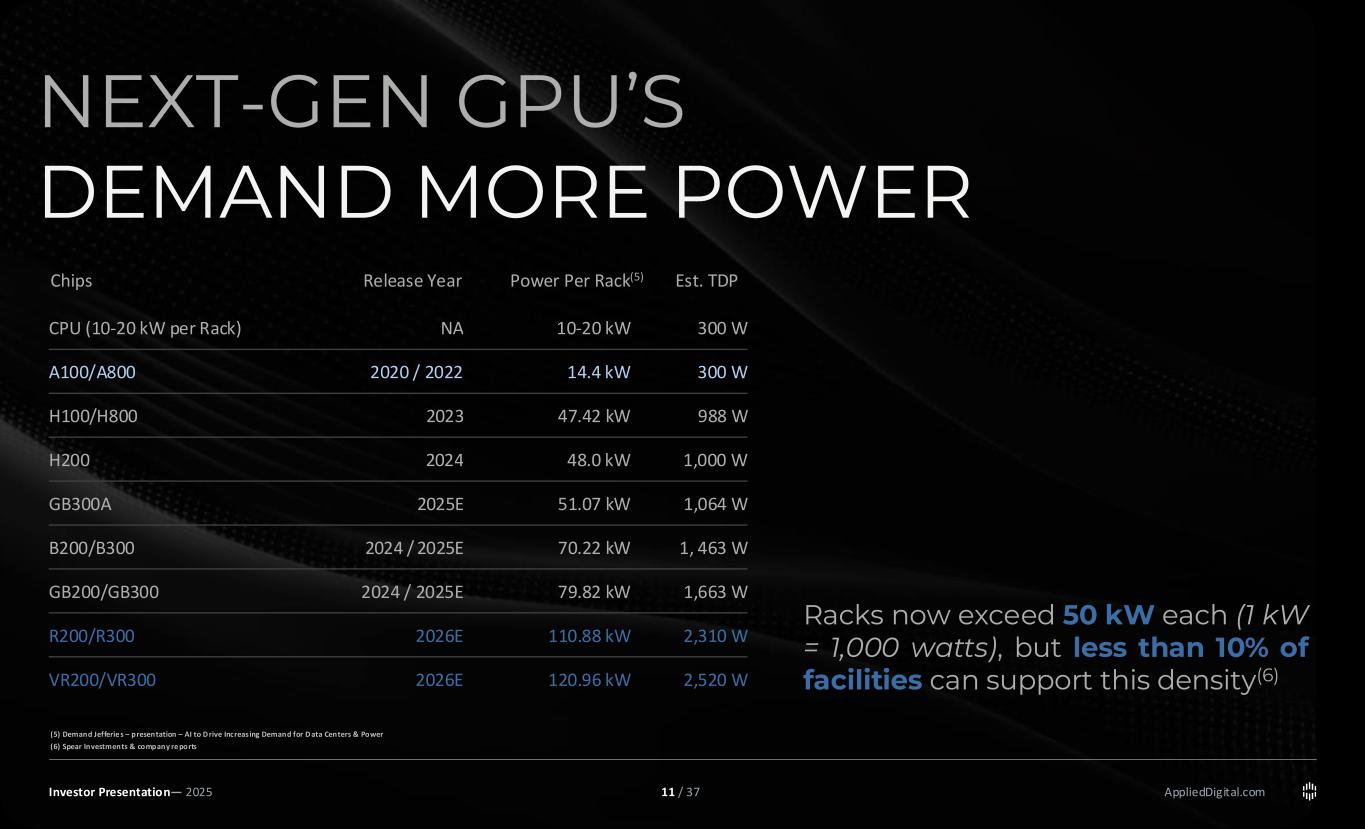
AppliedDigital.com NEXT-GEN GPU’S DEMAND MORE POWER Investor Presentation— 2025 (5) Demand Jefferie s – presentation – AI to D rive Increasing Demand for D ata Centers & Power (6) Spear Investments & company re ports CPU (10-20 kW per Rack) NA 10-20 kW 300 W A100/A800 2020 / 2022 14.4 kW 300 W H100/H800 2023 47.42 kW 988 W H200 2024 48.0 kW 1,000 W GB300A 2025E 51.07 kW 1,064 W B200/B300 2024 / 2025E 70.22 kW 1, 463 W GB200/GB300 2024 / 2025E 79.82 kW 1,663 W R200/R300 2026E 110.88 kW 2,310 W VR200/VR300 2026E 120.96 kW 2,520 W Chips Release Year Power Per Rack(5) Est. TDP Racks now exceed 50 kW each (1 kW = 1,000 watts), but less than 10% of facilities can support this density(6) 11 / 37
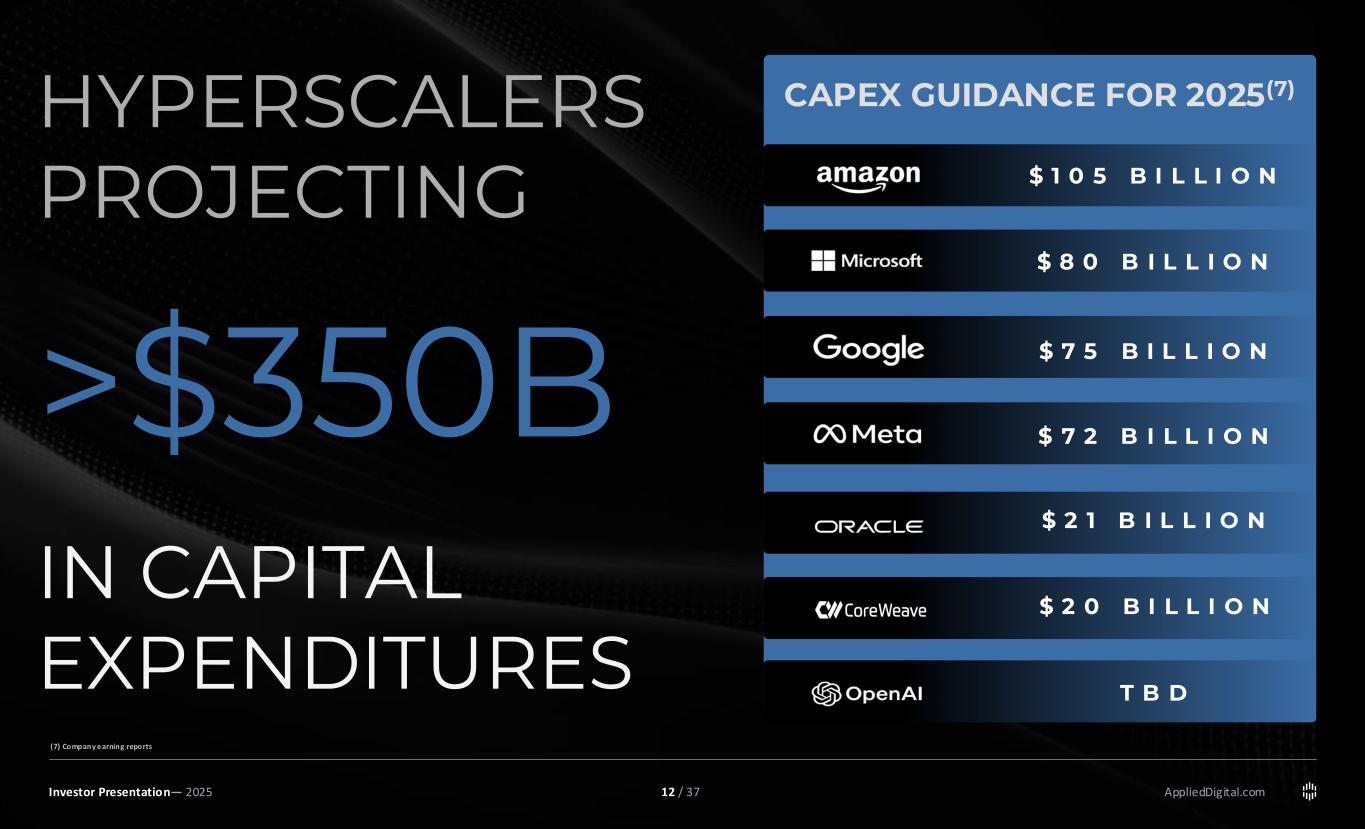
AppliedDigital.com HYPERSCALERS PROJECTING >$350B IN CAPITAL EXPENDITURES Investor Presentation— 2025 (7) Company e arning reports CAPEX GUIDANCE FOR 2025(7) $ 1 0 5 B I L L I O N $ 8 0 B I L L I O N $ 7 5 B I L L I O N $ 7 2 B I L L I O N $ 2 1 B I L L I O N $ 2 0 B I L L I O N T B D 12 / 37
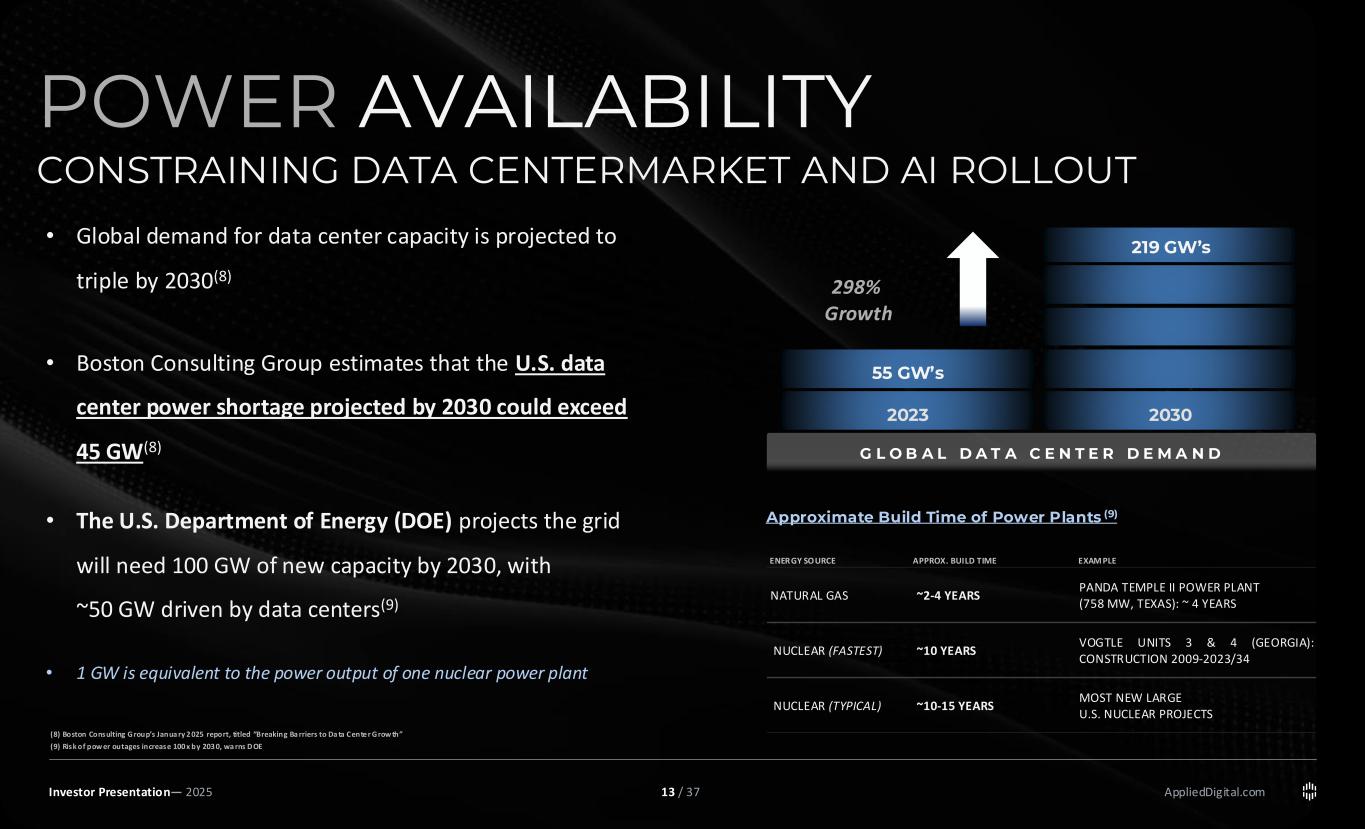
AppliedDigital.comInvestor Presentation— 2025 (8) Boston Consulting Group’s Janua ry 2 025 report, titled “Breaking Ba rriers to Da ta Cente r Grow th” (9) Risk of pow er outages increase 100 x by 203 0, wa rns D OE POWER AVAILABILITY CONSTRAINING DATA CENTERMARKET AND AI ROLLOUT • Boston Consulting Group estimate that the U.S. data center power shortage could exceed 45 GW is projected by 2030(8) • The U.S. Department of Energy (DOE) projects the grid will need 100 GW of new capacity by 2030, with ~50 GW driven by data centers(8) • 1 GW is equivalent to the power output of one nuclear power plant • Global demand for data center capacity is projected to triple by 2030(8) • Boston Consulting Group estimates that the U.S. data center power shortage projected by 2030 could exceed 45 GW(8) • The U.S. Department of Energy (DOE) projects the grid will need 100 GW of new capacity by 2030, with ~50 GW driven by data centers(9) • 1 GW is equivalent to the power output of one nuclear power plant 2023 2030 55 GW’s 219 GW’s 298% Growth G L O B A L D A T A C E N T E R D E M A N D NATURAL GAS ~2-4 YEARS PANDA TEMPLE II POWER PLANT (758 MW, TEXAS): ~ 4 YEARS NUCLEAR (FASTEST) ~10 YEARS VOGTLE UNITS 3 & 4 (GEORGIA): CONSTRUCTION 2009-2023/34 NUCLEAR (TYPICAL) ~10-15 YEARS MOST NEW LARGE U.S. NUCLEAR PROJECTS Approximate Build Time of Power Plants (9) 13 / 37
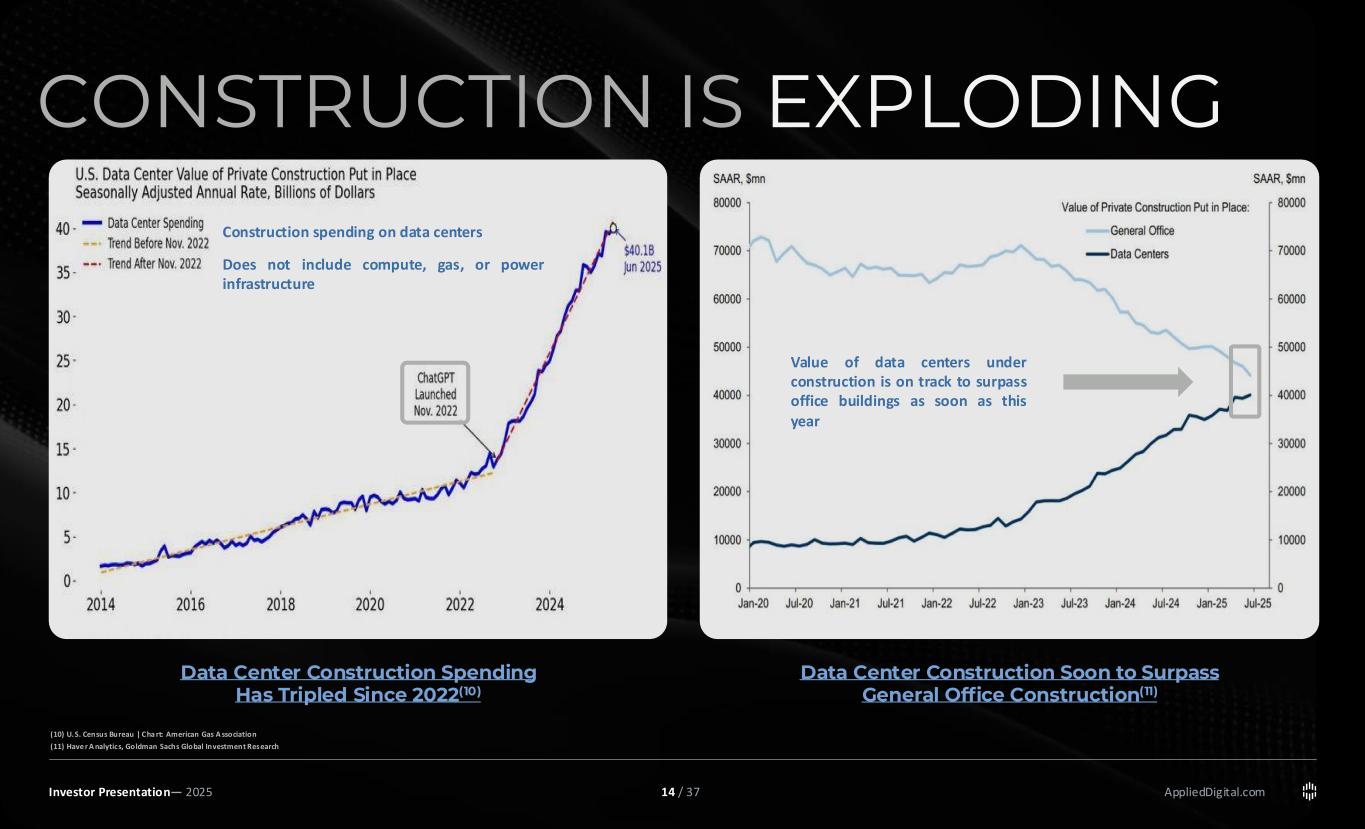
AppliedDigital.comInvestor Presentation— 2025 CONSTRUCTION IS EXPLODING • Boston Consulting Group estimate that the U.S. data center power shortage could exceed 45 GW is projected by 2030(8) • The U.S. Department of Energy (DOE) projects the grid will need 100 GW of new capacity by 2030, with ~50 GW driven by data centers(8) • 1 GW is equivalent to the power output of one nuclear power plant Data Center Construction Spending Has Tripled Since 2022(10) Data Center Construction Soon to Surpass General Office Construction(11) Value of data centers under construction is on track to surpass office buildings as soon as this year Construction spending on data centers Does not include compute, gas, or power infrastructure (10) U.S. Census Bureau | Cha rt: American Gas A ssociation (11) Have r A nalytics, Goldman Sachs Global Investment Research 14 / 37
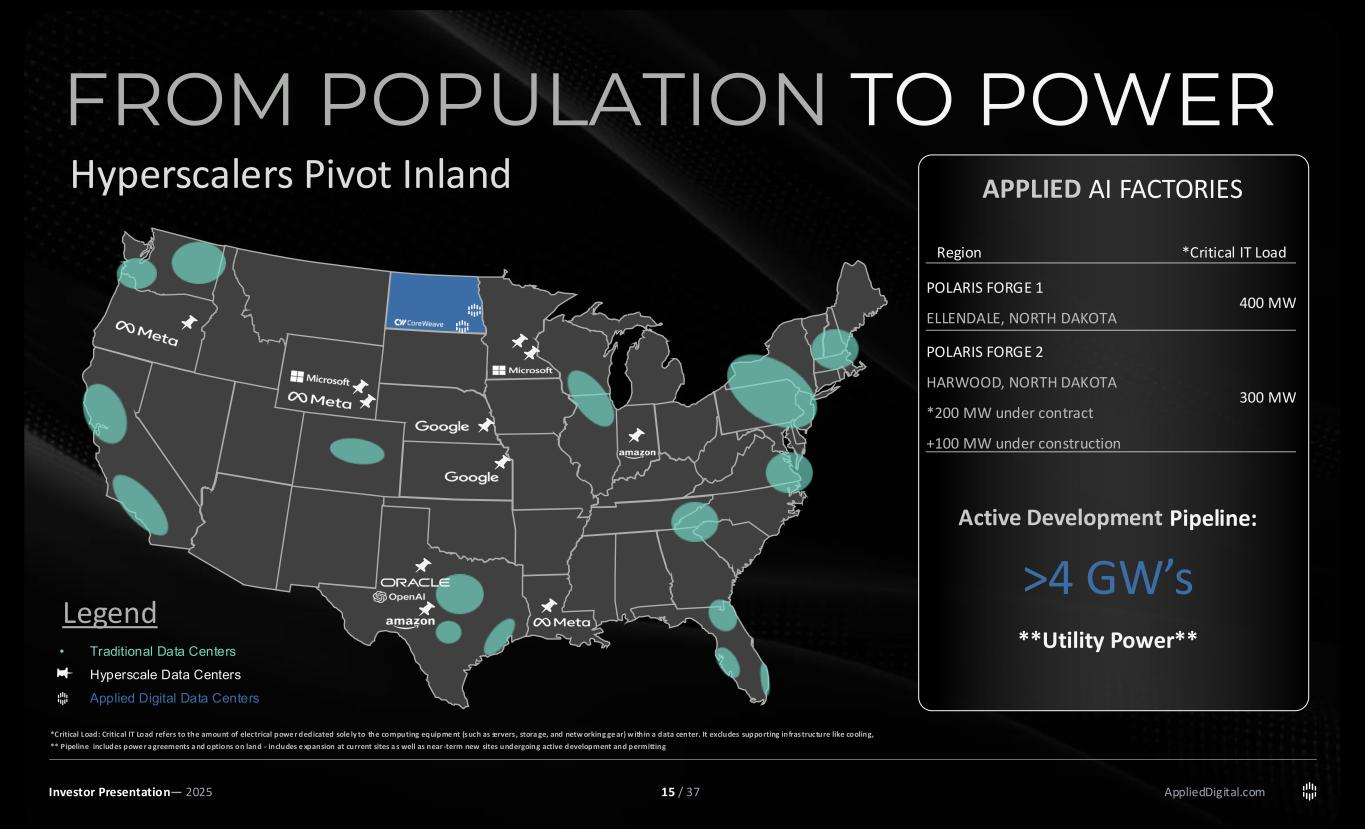
AppliedDigital.com Title AI FACTORIES FROM POPULATION TO POWER Investor Presentation— 2025 Hyperscalers Pivot Inland • Traditional Data Centers • Hyperscale Data Centers • Applied Digital Data Centers POLARIS FORGE 1 ELLENDALE, NORTH DAKOTA 400 MW POLARIS FORGE 2 HARWOOD, NORTH DAKOTA *200 MW under contract +100 MW under construction 300 MW Region *Critical IT Load Pipeline: >4 GW’s **Utility Power** *Critical Load: Critical IT Load refers to the amount of electrical powe r dedicated sole ly to the computing equipme nt (such as servers , stora ge, and netw orking ge ar) w ithin a data center. It excludes supporting infrastructure like cooling, ** Pipeline includes powe r a greements a nd options on land - includes e xpansion at current sites a s well as near-term new sites undergoing active development and permitting Legend 15 / 37
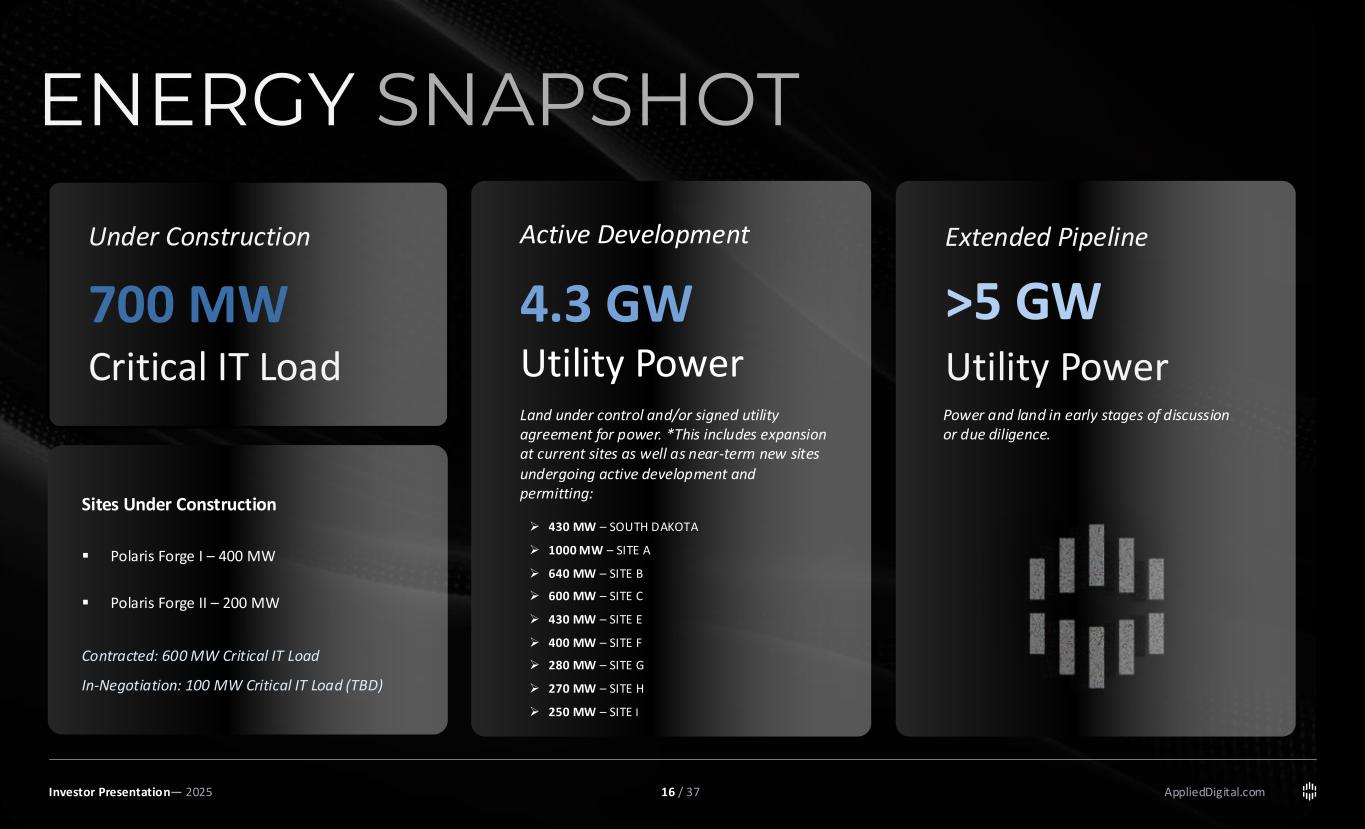
AppliedDigital.com ENERGY SNAPSHOT Investor Presentation— 2025 700 MW Critical IT Load Sites Under Construction ▪ Polaris Forge I – 400 MW ▪ Polaris Forge II – 200 MW Contracted: 600 MW Critical IT Load In-Negotiation: 100 MW Critical IT Load (TBD) Under Construction Extended Pipeline >5 GW Utility Power ➢ 430 MW – SOUTH DAKOTA ➢ 1000 MW – SITE A ➢ 640 MW – SITE B ➢ 600 MW – SITE C ➢ 430 MW – SITE E ➢ 400 MW – SITE F ➢ 280 MW – SITE G ➢ 270 MW – SITE H ➢ 250 MW – SITE I Active Development 4.3 GW Utility Power Land under control and/or signed utility agreement for power. *This includes expansion at current sites as well as near-term new sites undergoing active development and permitting: Power and land in early stages of discussion or due diligence. 16 / 37
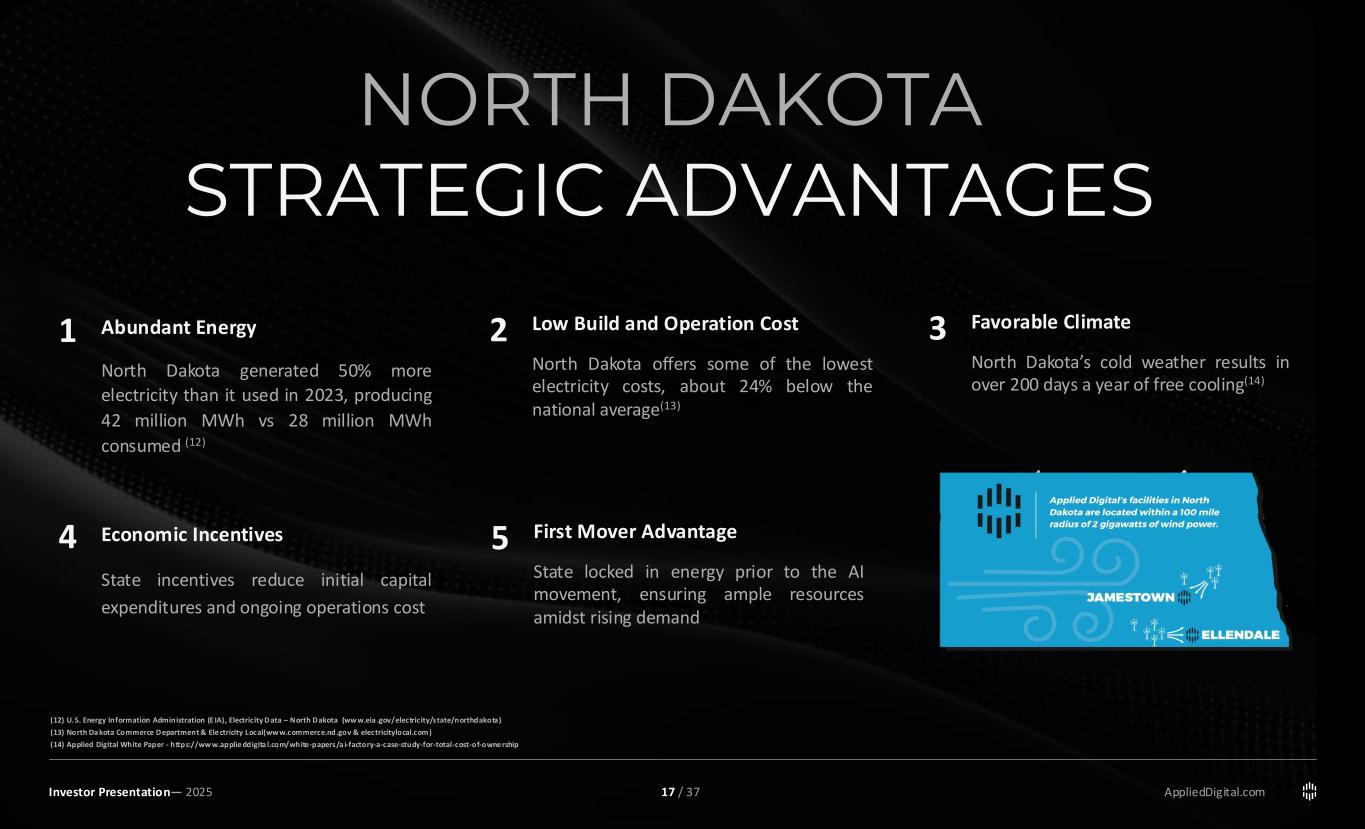
AppliedDigital.com NORTH DAKOTA STRATEGIC ADVANTAGES (12) U.S. Energy Information Administration (E IA), Electricity D ata – North D akota (ww w.eia .gov/electricity/state/northdakota) (13) North Da kota Commerce D epartment & Ele ctricity Local(ww w.commerce.nd.gov & electricitylocal.com) (14) Applied Digital White Paper - https://ww w.applie ddigita l.com/white-papers/a i-factory-a-case-study-for-total-cost-of-owne rship Abundant Energy North Dakota generated 50% more electricity than it used in 2023, producing 42 million MWh vs 28 million MWh consumed (12) 1 Low Build and Operation Cost North Dakota offers some of the lowest electricity costs, about 24% below the national average(13) 2 Favorable Climate North Dakota’s cold weather results in over 200 days a year of free cooling(14) 3 Economic Incentives State incentives reduce initial capital expenditures and ongoing operations cost 4 First Mover Advantage State locked in energy prior to the AI movement, ensuring ample resources amidst rising demand 5 Investor Presentation— 2025 17 / 37
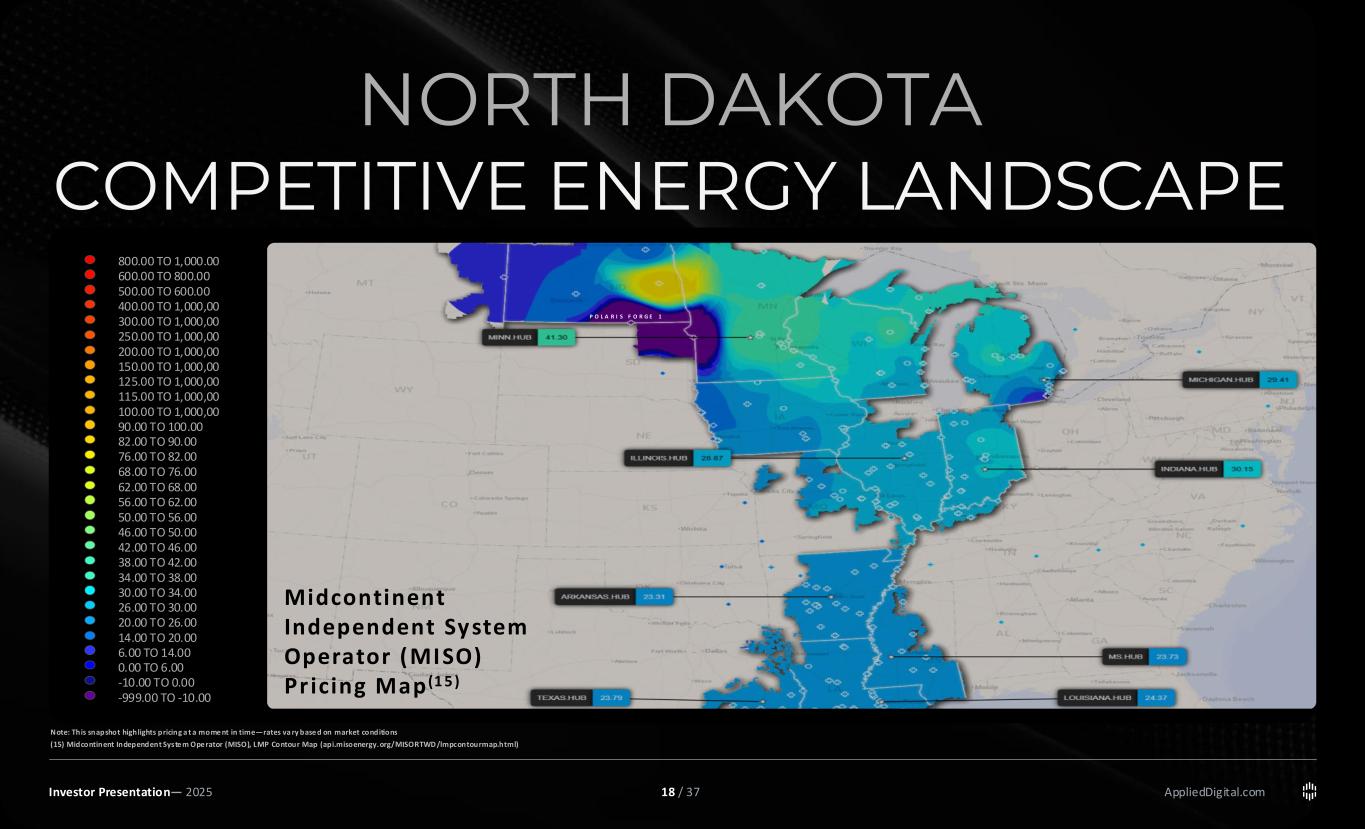
AppliedDigital.com NORTH DAKOTA COMPETITIVE ENERGY LANDSCAPE Investor Presentation— 2025 Note: This snapshot highlights pricing a t a mome nt in time—rates va ry base d on market conditions (15) Midcontinent Independent Syste m Ope rator (MISO), LMP Contour Map (api.misoenergy.org/MISORTWD /lmpcontourmap.html) P O L A R I S F O R G E 1 800.00 TO 1,000.00 600.00 TO 800.00 500.00 TO 600.00 400.00 TO 1,000,00 300.00 TO 1,000,00 250.00 TO 1,000,00 200.00 TO 1,000,00 150.00 TO 1,000,00 125.00 TO 1,000,00 115.00 TO 1,000,00 100.00 TO 1,000,00 90.00 TO 100.00 82.00 TO 90.00 76.00 TO 82.00 68.00 TO 76.00 62.00 TO 68.00 56.00 TO 62.00 50.00 TO 56.00 46.00 TO 50.00 42.00 TO 46.00 38.00 TO 42.00 34.00 TO 38.00 30.00 TO 34.00 26.00 TO 30.00 20.00 TO 26.00 14.00 TO 20.00 6.00 TO 14.00 0.00 TO 6.00 -10.00 TO 0.00 -999.00 TO -10.00 Midcontinent Independent System Operator (MISO) Pr icing Map (1 5 ) 18 / 37
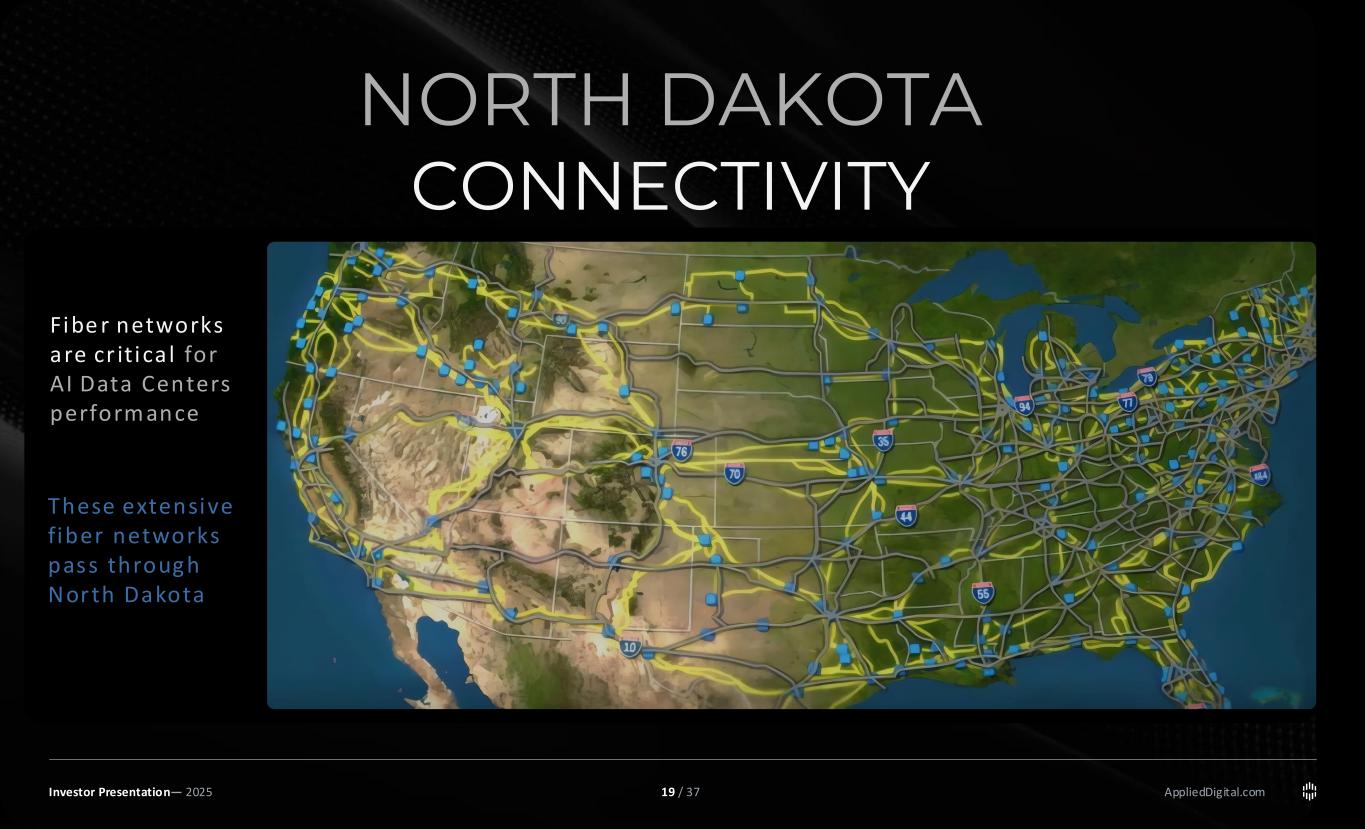
AppliedDigital.com NORTH DAKOTA CONNECTIVITY Investor Presentation— 2025 Fibe r networks are cr itica l for AI Data Centers perform ance These extensive fiber networks pass through North Dakota 19 / 37
POLARIS FORGE 1 03 AppliedDigital.com 400 MW AI CAMPUS OVERVIEW Investor Presentation— 2025 20 / 37
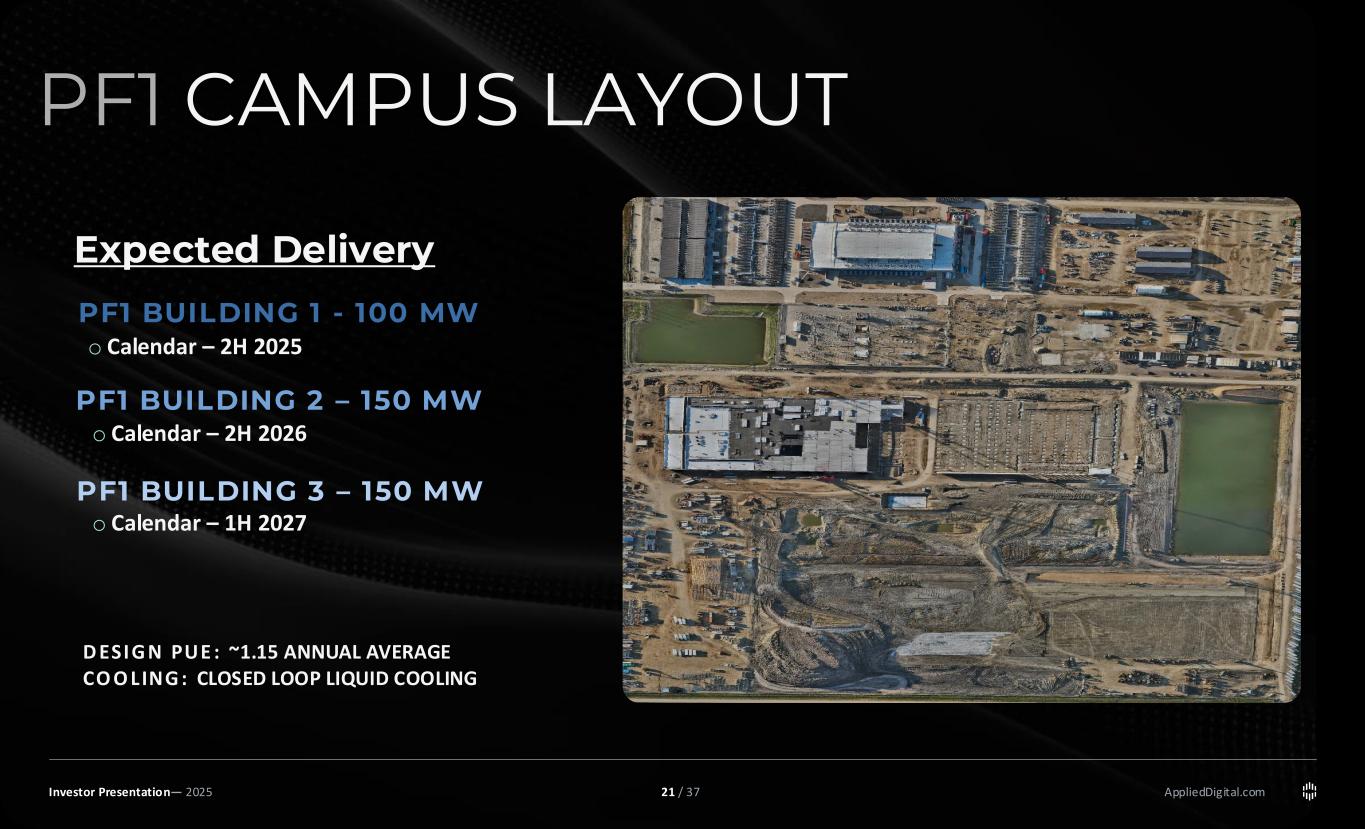
AppliedDigital.com PF1 CAMPUS LAYOUT PF1 BUILDING 1 - 100 MW PF1 BUILDING 2 – 150 MW PF1 BUILDING 3 – 150 MW D ESIG N PUE : ~1.15 ANNUAL AVERAGE CO O LING : CLOSED LOOP LIQUID COOLING o Calendar – 2H 2025 o Calendar – 2H 2026 o Calendar – 1H 2027 Expected Delivery Investor Presentation— 2025 21 / 37
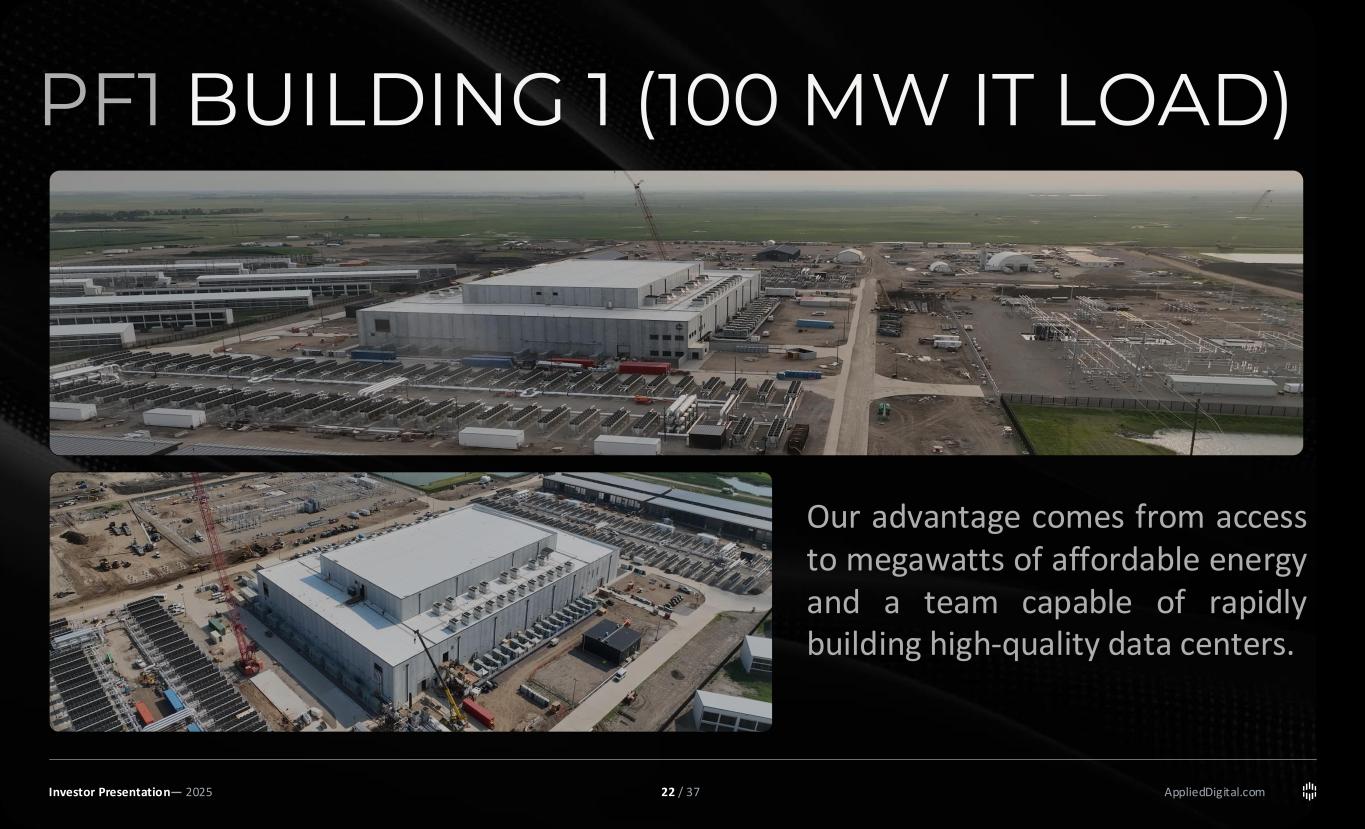
AppliedDigital.com PF1 BUILDING 1 (100 MW IT LOAD) Our advantage comes from access to megawatts of affordable energy and a team capable of rapidly building high-quality data centers. Investor Presentation— 2025 22 / 37
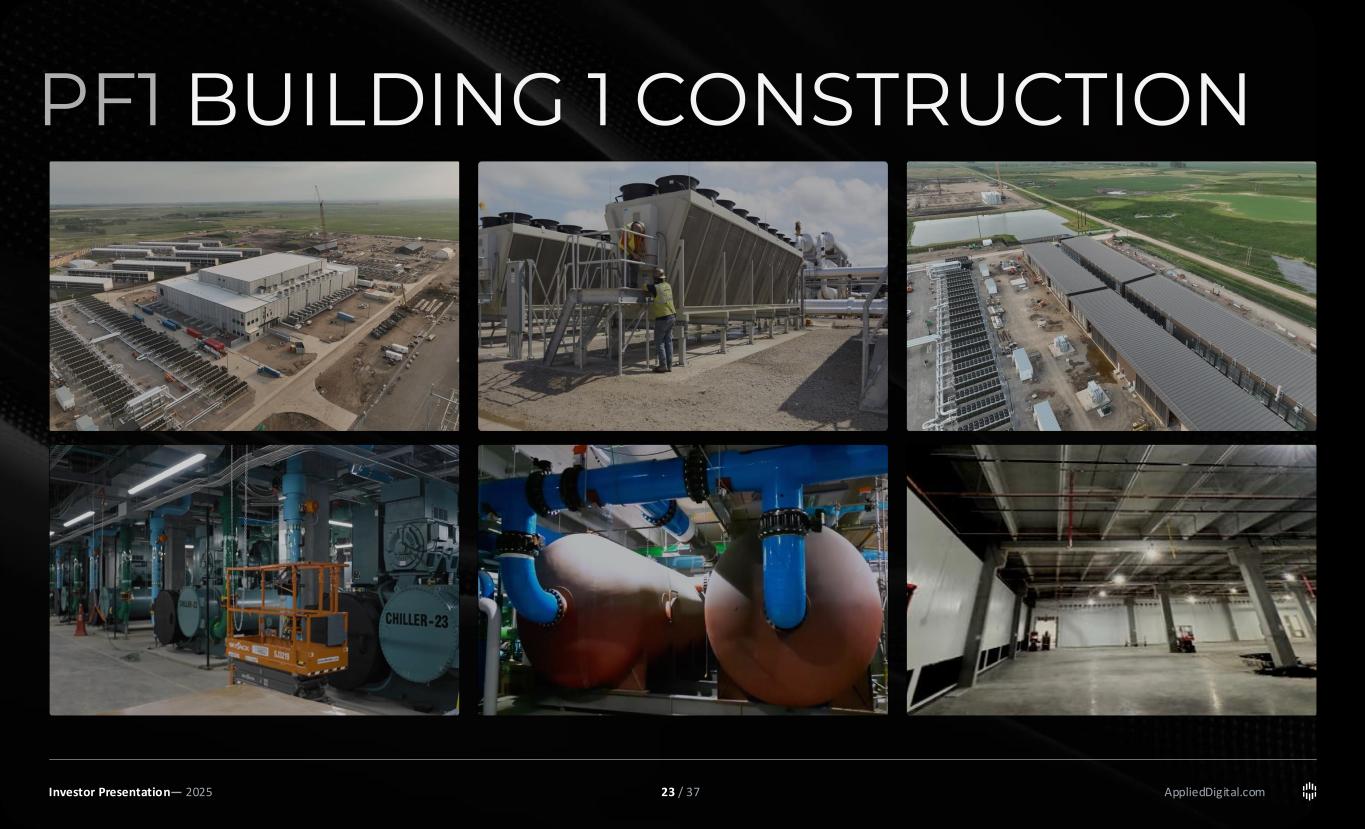
AppliedDigital.com PF1 BUILDING 1 CONSTRUCTION Investor Presentation— 2025 23 / 37
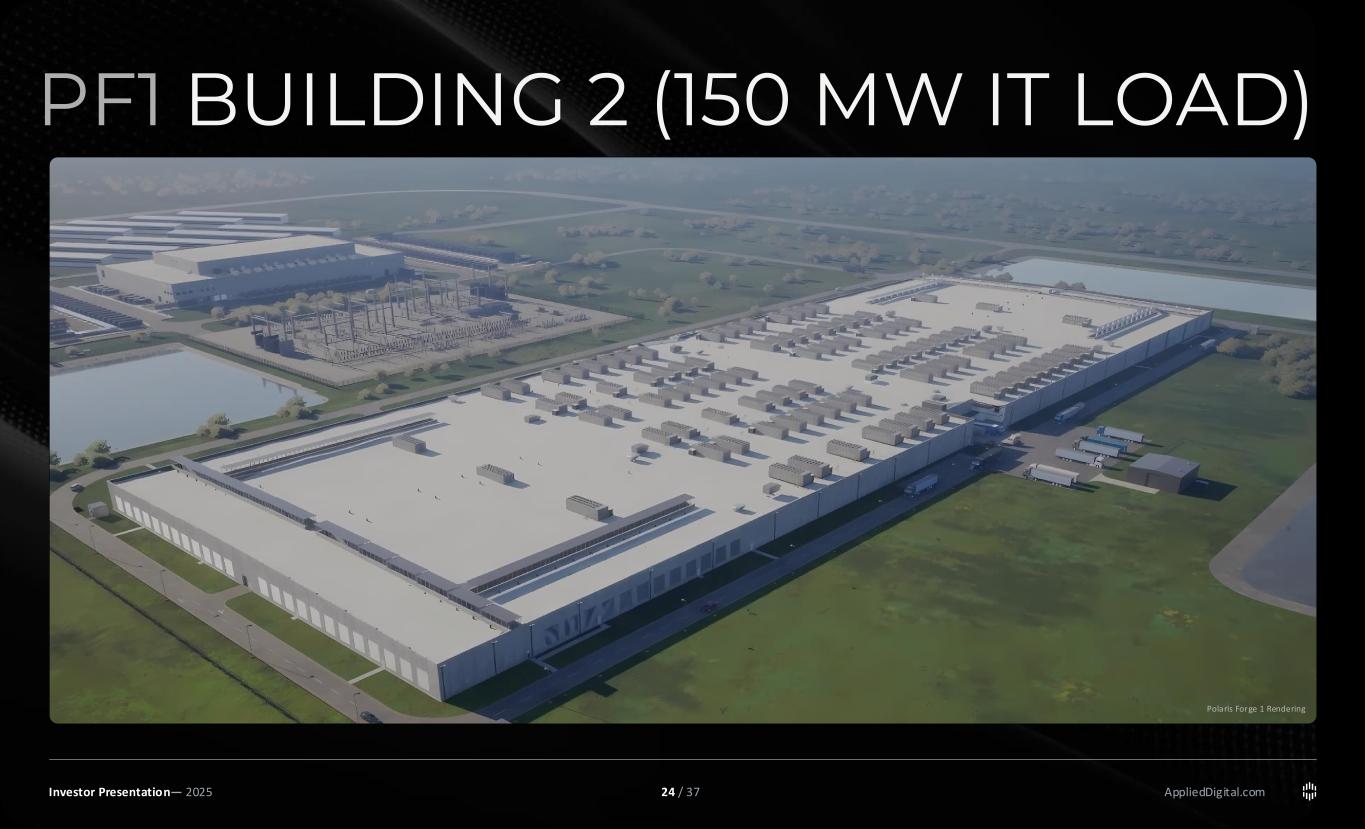
AppliedDigital.com PF1 BUILDING 2 (150 MW IT LOAD) Polaris Forge 1 Rendering Investor Presentation— 2025 24 / 37
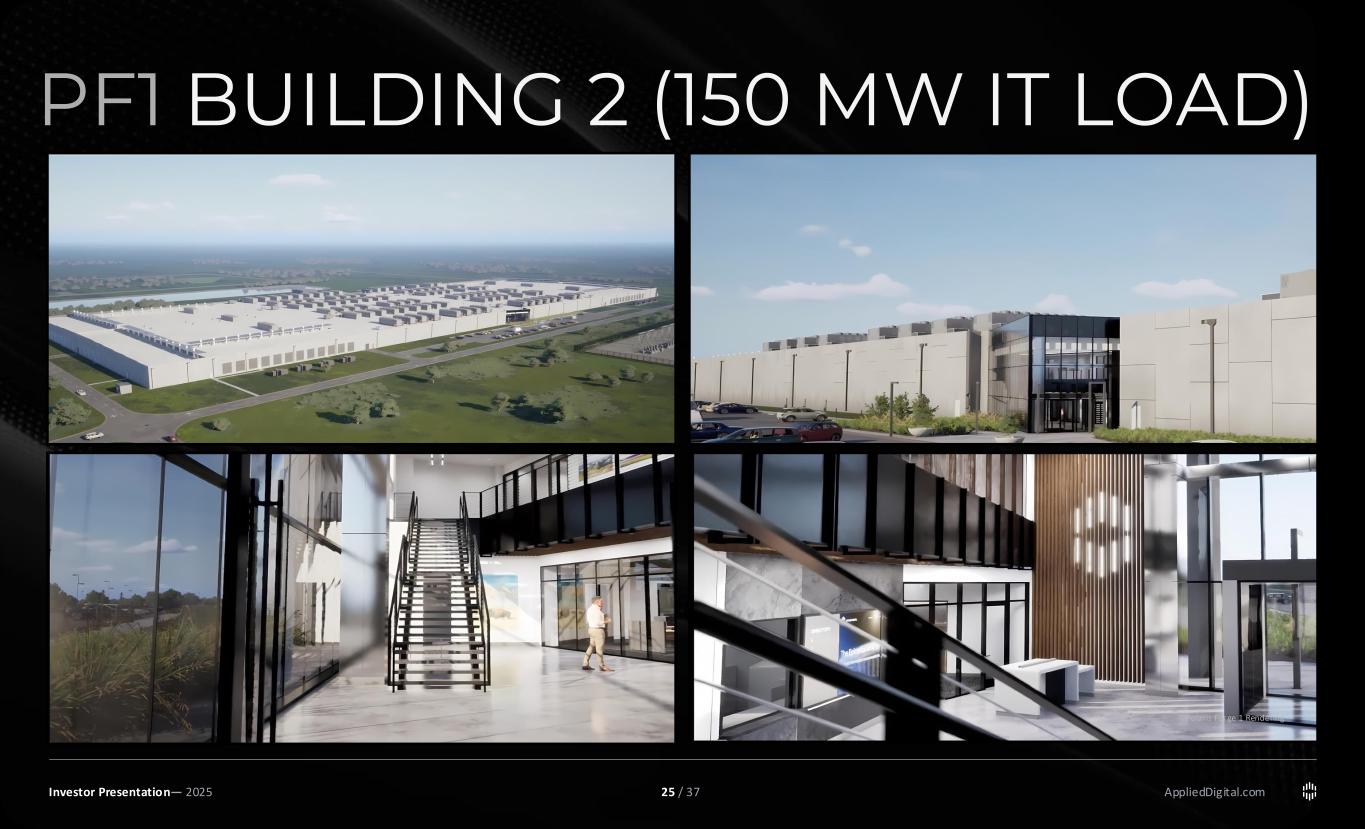
AppliedDigital.com PF1 BUILDING 2 (150 MW IT LOAD) Investor Presentation— 2025 Polaris Forge 1 Rendering 25 / 37
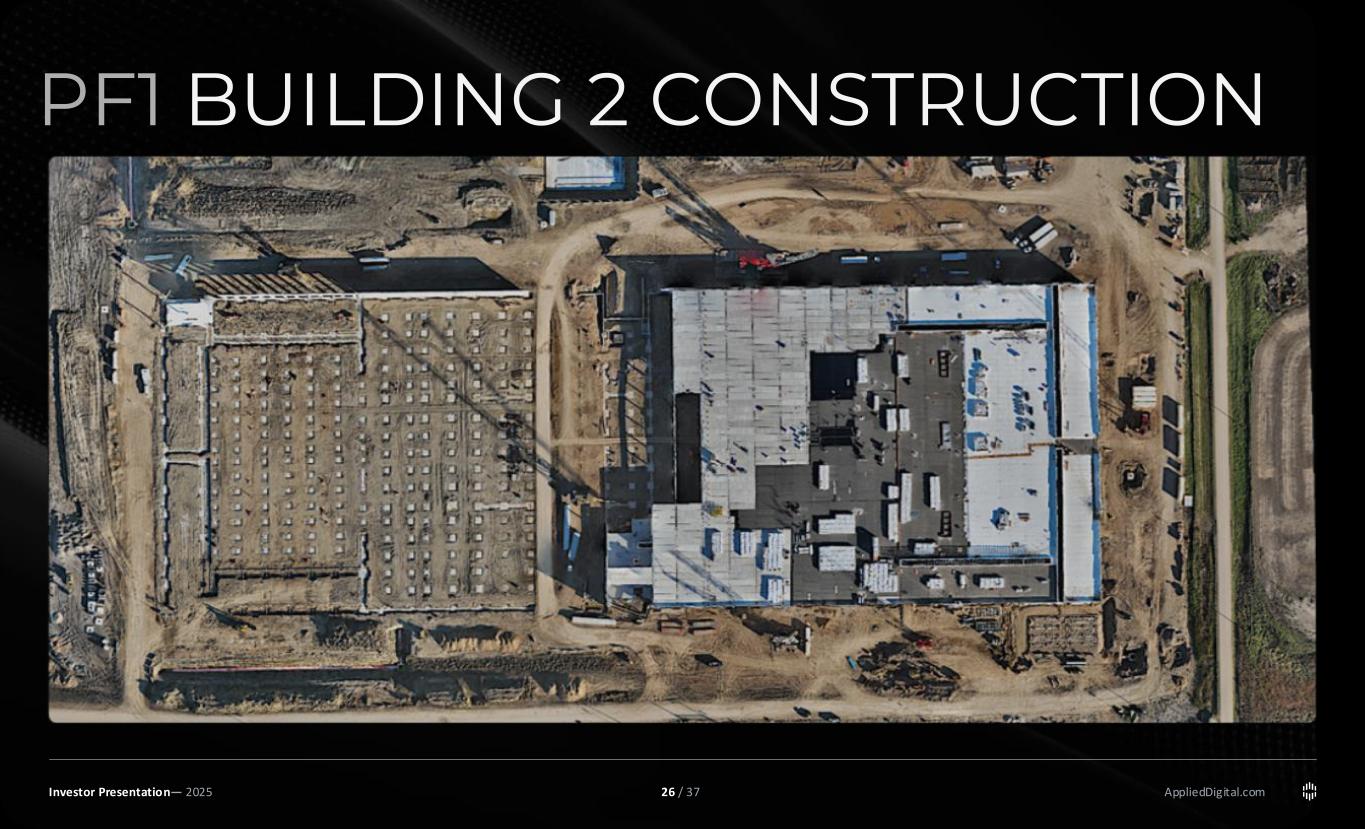
AppliedDigital.com PF1 BUILDING 2 CONSTRUCTION Investor Presentation— 2025 26 / 37
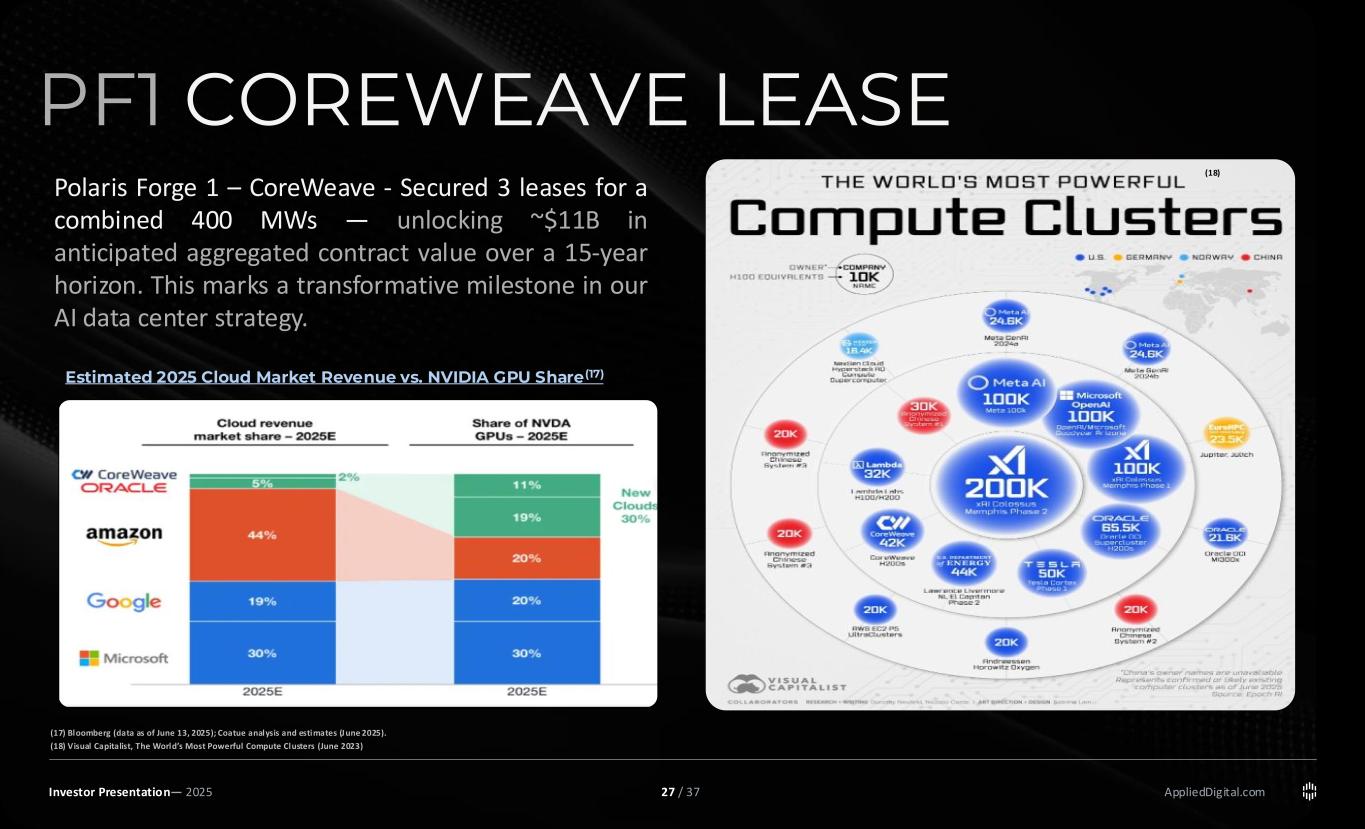
AppliedDigital.com PF1 COREWEAVE LEASE Polaris Forge 1 – CoreWeave - Secured 3 leases for a combined 400 MWs — unlocking ~$11B in anticipated aggregated contract value over a 15-year horizon. This marks a transformative milestone in our AI data center strategy. Estimated 2025 Cloud Market Revenue vs. NVIDIA GPU Share(17) (18) (17) Bloomberg (data as of June 13, 2025); Coatue analysis and estimates (June 2025). (18) Visual Capitalist, The World’s Most Powerful Compute Clusters (June 2023) Investor Presentation— 2025 27 / 37
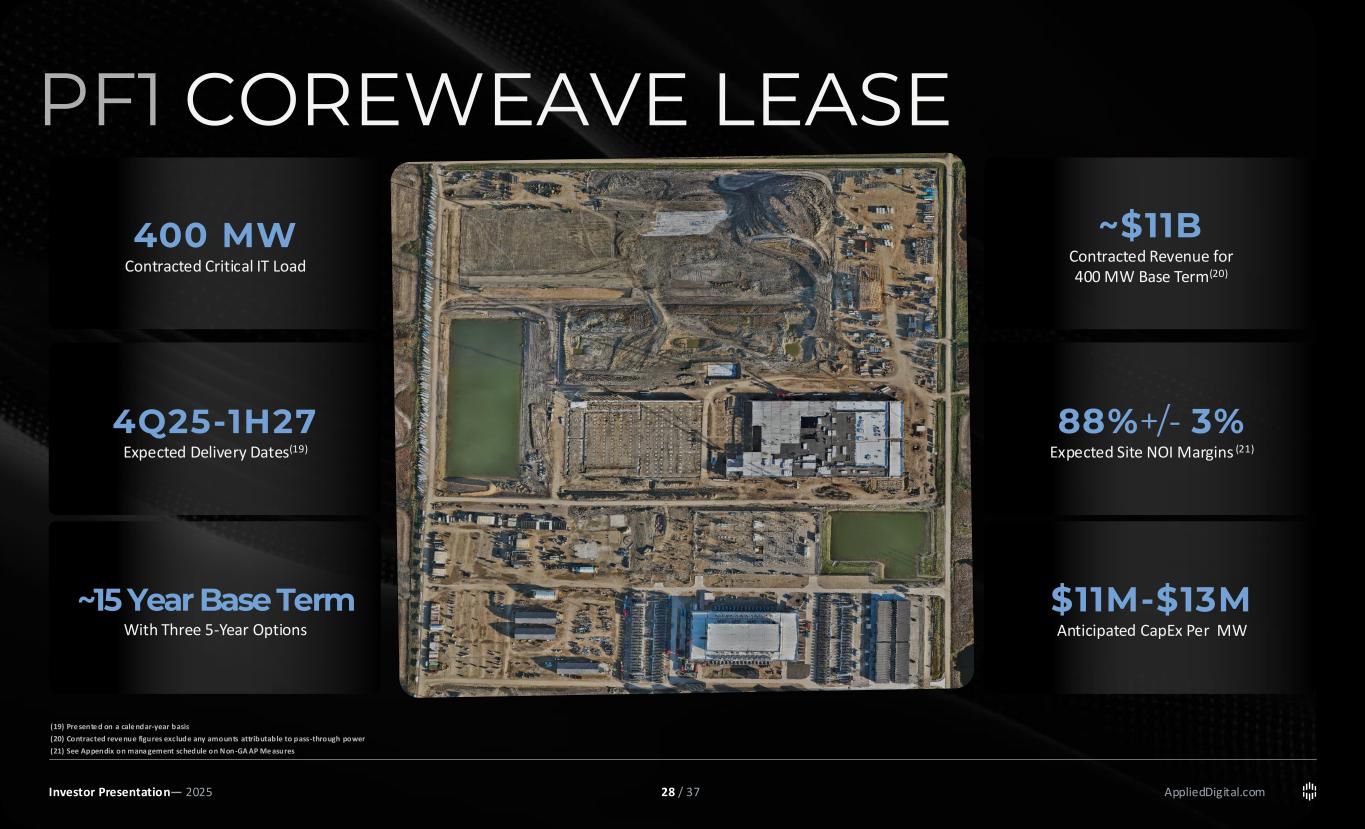
AppliedDigital.com PF1 COREWEAVE LEASE (17) 400 MW Contracted Critical IT Load 4Q25-1H27 Expected Delivery Dates(19) ~15 Year Base Term With Three 5-Year Options ~$11B Contracted Revenue for 400 MW Base Term(20) 88%+/- 3% Expected Site NOI Margins (21) $11M-$13M Anticipated CapEx Per MW (19) Pre sente d on a cale ndar-year basis (20) Contracted reve nue figures exclude any amounts attributable to pass-through power (21) See Appendix on mana gement schedule on Non-GA AP Me asures Investor Presentation— 2025 28 / 37
POLARIS FORGE 2 04 AppliedDigital.com 200 MW LEASE OVERVIEW Investor Presentation— 2025 29 / 37
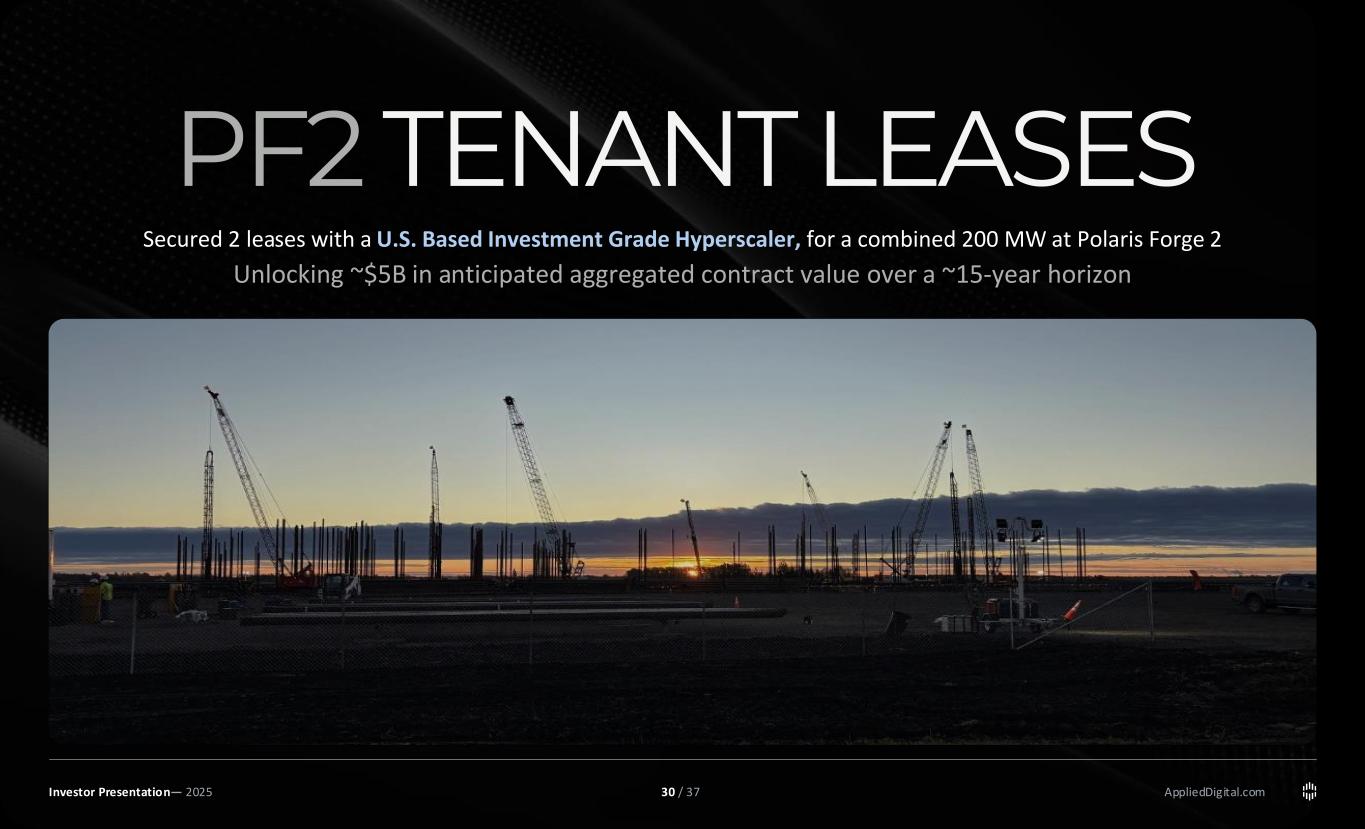
AppliedDigital.com PF2 TENANT LEASES Secured 2 leases with a U.S. Based Investment Grade Hyperscaler, for a combined 200 MW at Polaris Forge 2 Unlocking ~$5B in anticipated aggregated contract value over a ~15-year horizon Investor Presentation— 2025 30 / 37
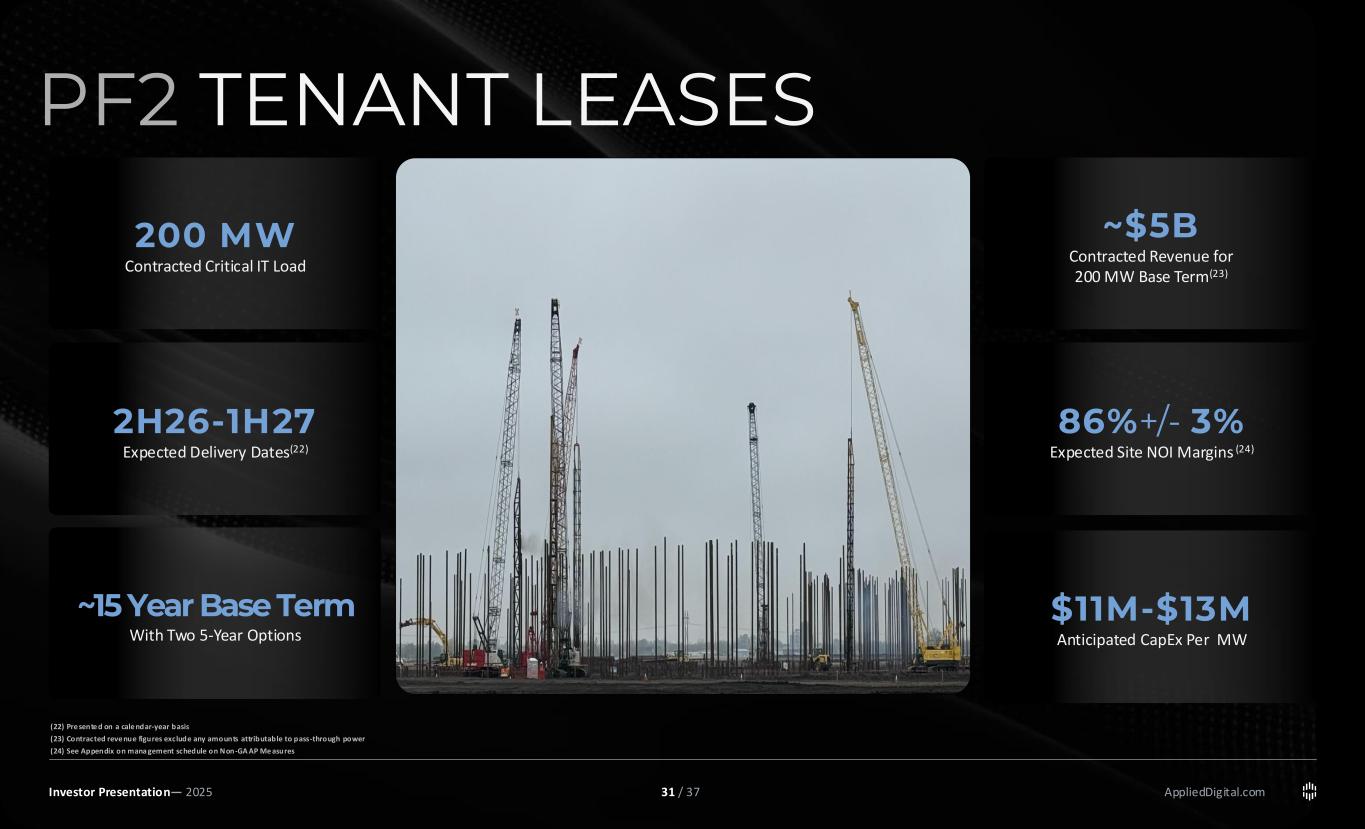
AppliedDigital.com PF2 TENANT LEASES (17) 200 MW Contracted Critical IT Load 2H26-1H27 Expected Delivery Dates(22) ~15 Year Base Term With Two 5-Year Options ~$5B Contracted Revenue for 200 MW Base Term(23) 86%+/- 3% Expected Site NOI Margins (24) (22) Pre sente d on a cale ndar-year basis (23) Contracted reve nue figures exclude any amounts attributable to pass-through power (24) See Appendix on mana gement schedule on Non-GA AP Me asures Investor Presentation— 2025 $11M-$13M Anticipated CapEx Per MW 31 / 37
BLOCKCHAIN 05 AppliedDigital.com OPERATIONS OVERVIEW Investor Presentation— 2025 32 / 37
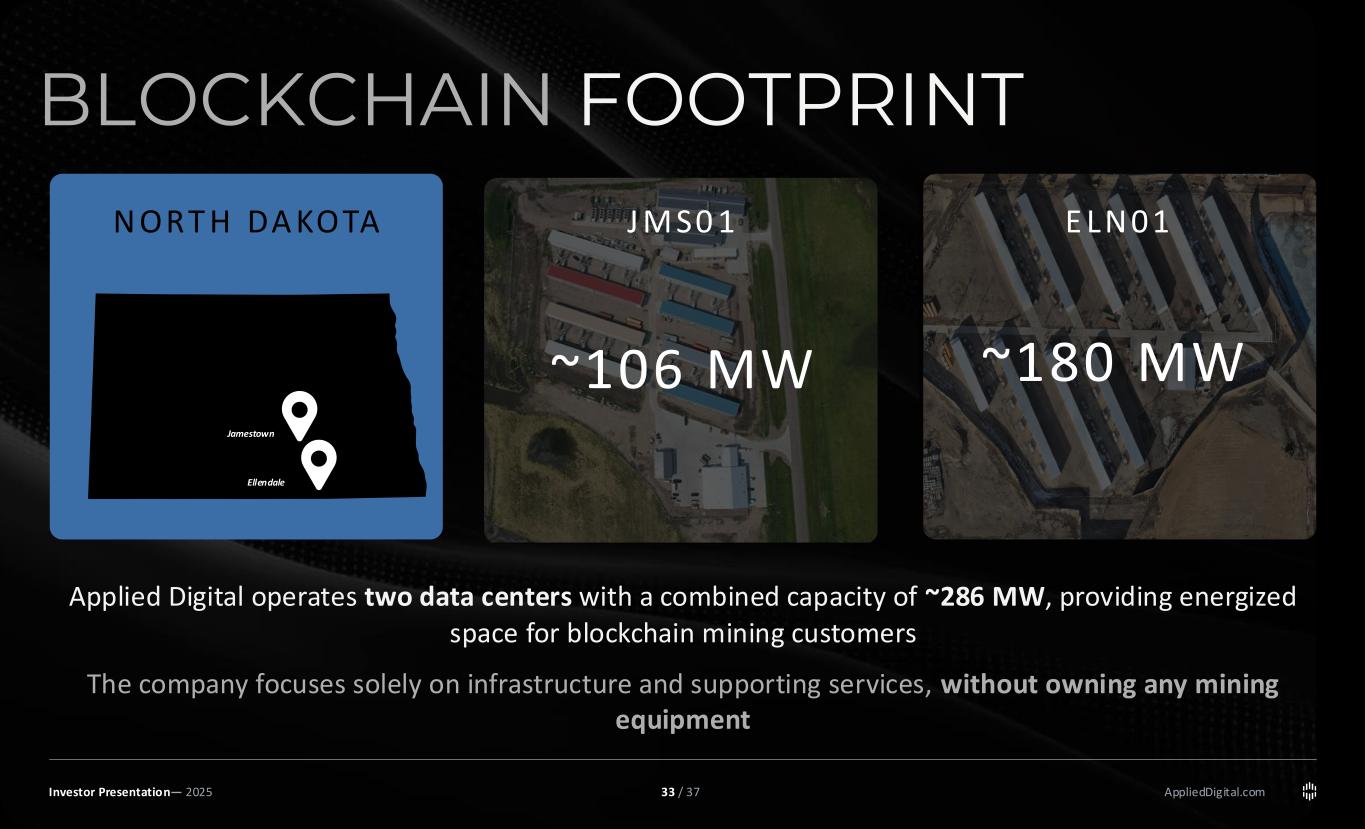
AppliedDigital.com BLOCKCHAIN FOOTPRINT Jamestown Ellendale N ORT H DA KOTA Applied Digital operates two data centers with a combined capacity of ~286 MW, providing energized space for blockchain mining customers The company focuses solely on infrastructure and supporting services, without owning any mining equipment J M S0 1 E LN 01 ~106 MW ~180 MW Investor Presentation— 2025 33 / 37
MACQUARIE TRANSACTION 06 AppliedDigital.comInvestor Presentation— 2025 34 / 37
35 / 37 AppliedDigital.com + Macquarie, #1 Infrastructure Investment Manager(25), has agreed to collaborate with Applied Digital, potentially committing up to $5B in capital, which could unlock $25B for Data Centers. TRANSACTION OVERVIEW Investor Presentation— 2025 (25) Investments & Pensions Europe (IPE) Rea l A ssets
Find out more about us at www.applieddigital.com For inquiries, contact info@appliddigital.com Corporate HQ Applied Digital Corporation 3811 Turtle Creek Blvd. Suite 2100 Dallas, TX 75219 Investor Relations Contacts Matt Glover and Ralf Esper Gateway Group, Inc. (949) 574-3860 APLD@gateway-grp.com
37 / 37 AppliedDigital.com Non-GAAP Financial Measures This Investor Presentation contains the following financial measures: Net Operating Income (NOI) and NOI Margin (as defined below), each of which is not calculated in accordance with U.S. Generally Accepted Accounting Principles (“GAAP”). Presentations of these non-GAAP financial measures are intended to aid investors in better understanding the factors and trends affecting the Company’s performance and liquidity. However, investors should not consider these non-GAAP financial measures as a substitute for financial measures determined in accordance with GAAP, including net income (loss), income (loss) from operations, net cash provided by (used in) operating activities, or revenue. The Company cannot reconcile itsexpected site NOI and NOI Margin without unreasonable effort because certain items that impactnet operating income and other reconciling metrics are out of the Company’s control and/or cannot be reasonably predicted at this time. Net Operating Income (NOI) and NOI Margin are non-GAAP financial measures that the Company defines as follows: NOI represents rental revenue less rental property operating expenses, property taxes and insurance expenses (as reflected in the statement of operations). NOI Margin is a ratio calculated by dividing NOI by aggregate rental revenue and is expressed as a percentage (“NOI margin”). NOI is commonly used by stockholders, a company’s management and industry analysts as a measurement of operating performance of the company’s rental portfolio. However, because NOI excludes depreciation and amortization and captures neither the changes in the value of the Company’s data centers that result from use or market conditions, nor the level of capital expenditures and capitalized leasing commissions necessary to maintain the operating performance of the Company’s data centers, all of which have real economic effect and could materially impact the Company’s results of operations, the utility of NOI and NOI Margin as measures of the Company’s performance is limited. Other companies, including REITs, may calculate NOI and NOI Margin differently than we do and, accordingly, our NOI and NOI Margin may not be comparable to these companies’ NOI and NOI Margin. These non-GAAP financial measures should be considered only as supplemental to financial measures such as net income, computed in accordance with GAAP, as measures of Company’s performance. NOI reflects expected stabilized net operating income and is a non-GAAP financial measure. Actual results may differ materially due to lease-up timing, operating costs, and other factors. Appendix Management Statements on Non-GAAP Measures Investor Presentation— 2025